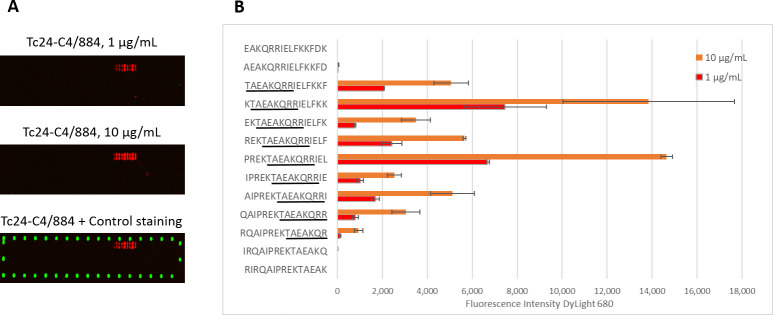
Fig 2. Linear epitope mapping of monoclonal antibody Tc24-C4/884.
A) Scan of the microarray showing an increased intensity of DyLight 680 (red) in a stretch of adjacent peptide sequences when 1 and 10 μg/mL Tc24-C4/884 was used. DyLight 800 was used as a positive control (green). B) Measured median Fluorescent Intensity of DyLight 680 plotted with their corresponding peptide sequences. The consensus sequence is underlined in black.

