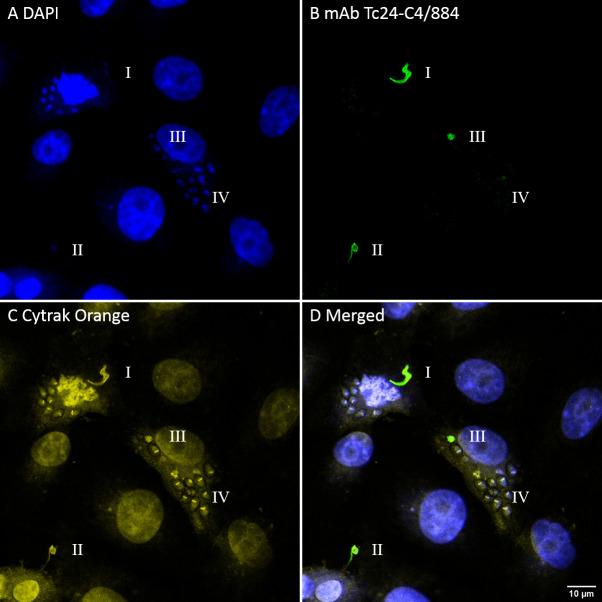
Fig 4. Fluorescence confocal microscopy images of VERO cells infected with T. cruzi showing the different Tc24 expression in parasitic stages.
Different transitions between trypomastigote and amastigote can be observed in I, II, III and IV. I: trypomastigote, II: trypomastigote with reduced flagella, III: complete transition to amastigote, IV: amastigotes with multiple divisions. A) In blue, DAPI nuclear stain. B) In green, mAb Tc24-C4/884 stained by goat anti-mouse IgG (H+L) Alexa Fluor 488. C) In yellow, CyTRAK Orange DNA and cytoplasmic stain. D) Merged image of A-C. Pixel size of images: 102 nm x 102 nm.

