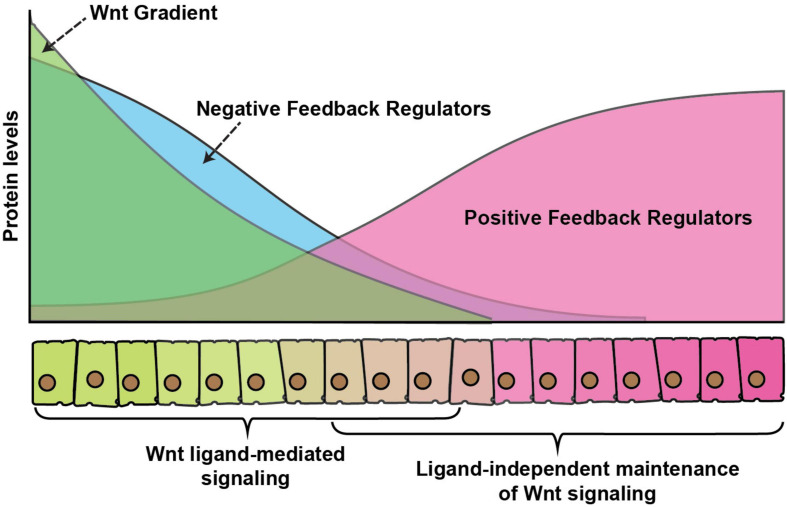
FIGURE 4.
Wnt gradient and feedback regulators. A graphical representation of feedback regulation of Wnt signaling. Green color represents secreted Wnt protein gradient over the receiving cells. Blue color represents expression of negative feedback regulators which is higher in cells exposed to high Wnt levels, whereas positive feedback regulators (red) are higher in cells with exposure to low-levels or no Wnt ligands. The signaling activity is regulated by a combinatorial effect of direct ligand-mediated signaling, the dampening effect of the negative feedback regulators and enhancement of ligand or maintenance of signaling in the absence of ligand by the positive feedback regulators.

