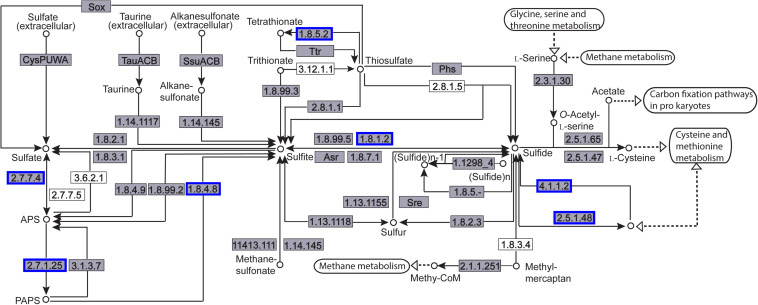
FIGURE 10.
Distribution of the differentially expressed genes (DEGs) in the sulfur metabolism pathway. Compared with the control group, an enzyme with a blue frame is related to a downregulated gene, an enzyme with a red frame is related to an upregulated gene. The number within the frames represents the enzyme code.

