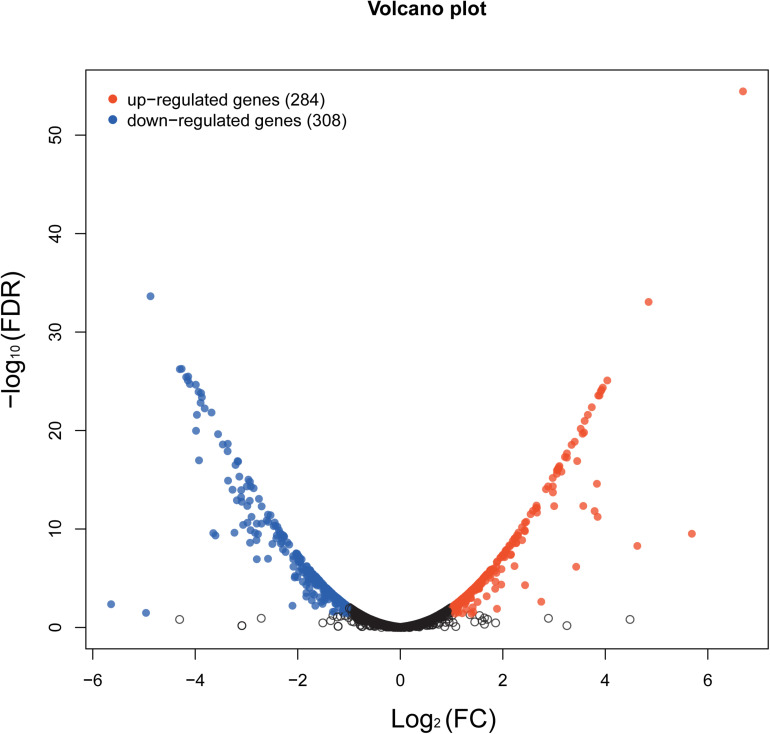
FIGURE 7.
Volcano map showing the overall scatter of differentially expressed genes (DEGs) in Staphylococcus epidermidis with or without aloe-emodin treatment. The abscissa indicates the fold-change in gene expression between the two groups (treatment/control). The ordinate indicates the statistical test values for the differences in the fold-change of expression of the transcripts. Each point in the figure represents a specific gene or transcript. Red dots indicate a significantly upregulated gene, blue dots indicate a significantly downregulated gene, and black dots indicate a non-significant change in gene expression. The further the dot is located toward the outside and top of the map, the higher the significant difference in expression.

