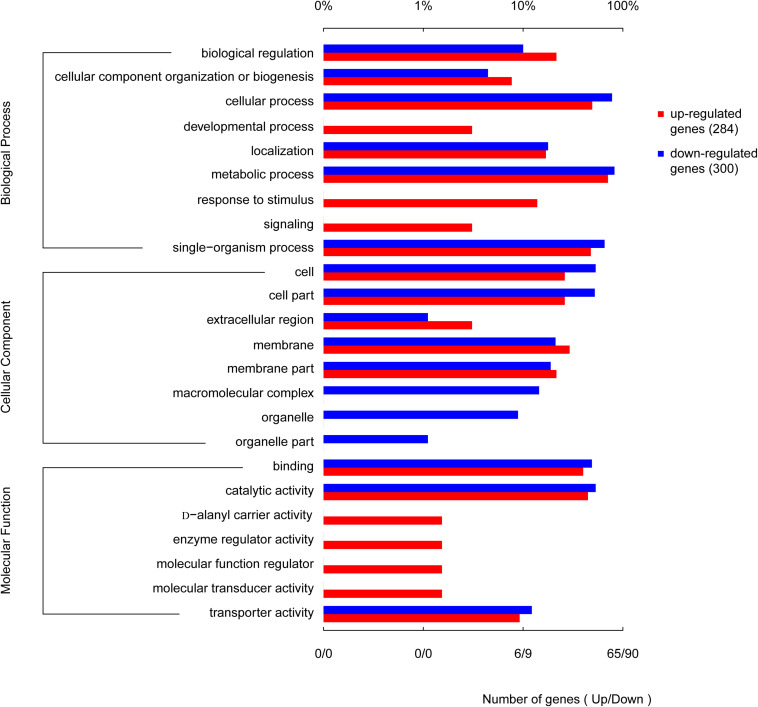
FIGURE 8.
Functional categories of the differentially expressed genes (DEGs), broadly separated into biological processes, cellular components, and molecular function based on Gene Ontology (GO) enrichment analysis. The lower abscissa indicates the number of genes annotated to a certain GO term, while the upper abscissa indicates the percentage of genes annotated to a certain GO term amongst the total number of annotated genes.

