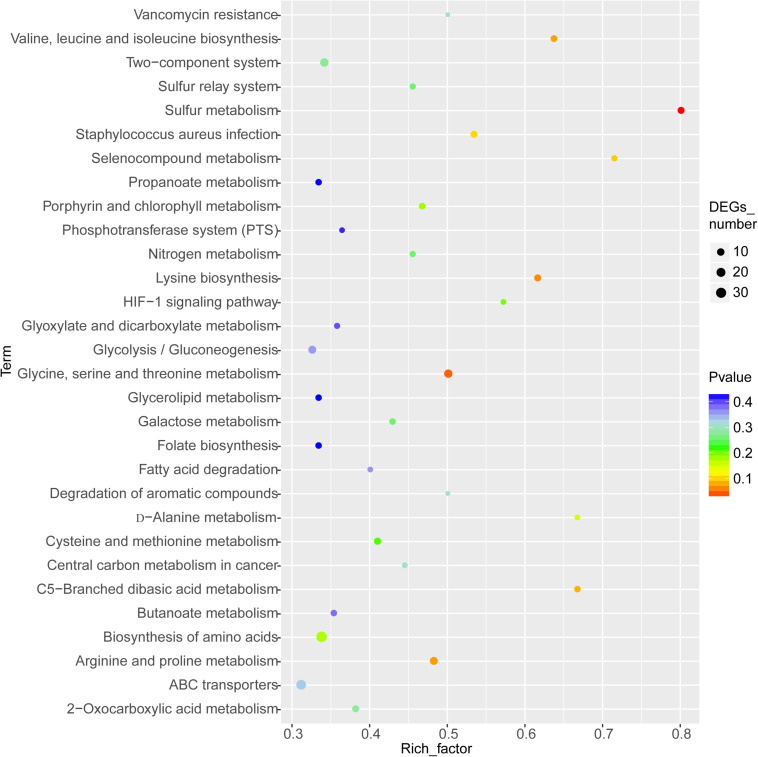
FIGURE 9.
Kyoto Encyclopedia of Genes and Genomes enrichment analysis of the differentially expressed genes (DEGs). The horizontal axis represents the enrichment factor [enriched to a Gene Ontology (GO) term]. The number of DEGs accounts for the ratio of the number of background genes obtained by sequencing. The ordinate indicates the GO term enriched features. The larger the circle, the greater the number of DEGs enriched in this function.

