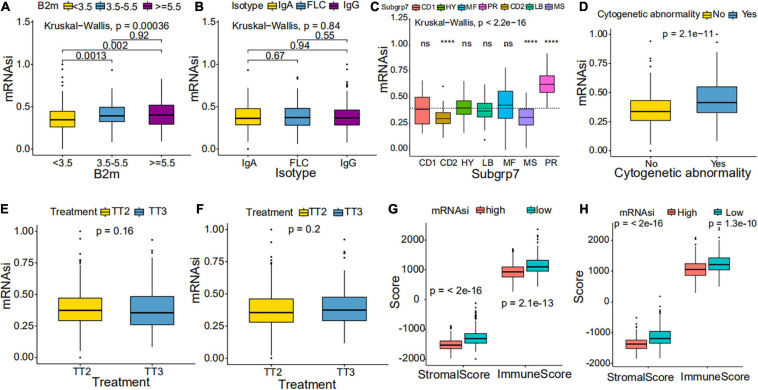
FIGURE 4.
Clinical characteristics in low mRNAsi and high mRNAsi MM patients. (A,B) Differences in mRNAsi between distinct B2M groups (A) and isotype groups (B) in patients with MM. The upper and lower ends of the boxes represent the interquartile range of values. The lines in the boxes represent median values. (C,D) Difference in mRNAsi between distinct subgroups (C) and cytogenetic abnormalities groups (D) in patients with MM. (E,F) Difference in mRNAsi between distinct treatment regimen groups in patients of the GSE24080 cohort (E) or the GSE4204 cohort (F). (G,H) Difference in stromalscore and immunescore between high and low mRNAsi samples of the GSE24080 cohort (G) or the GSE4204 cohort (H). ****p < 0.0001.

