
Figure 10.
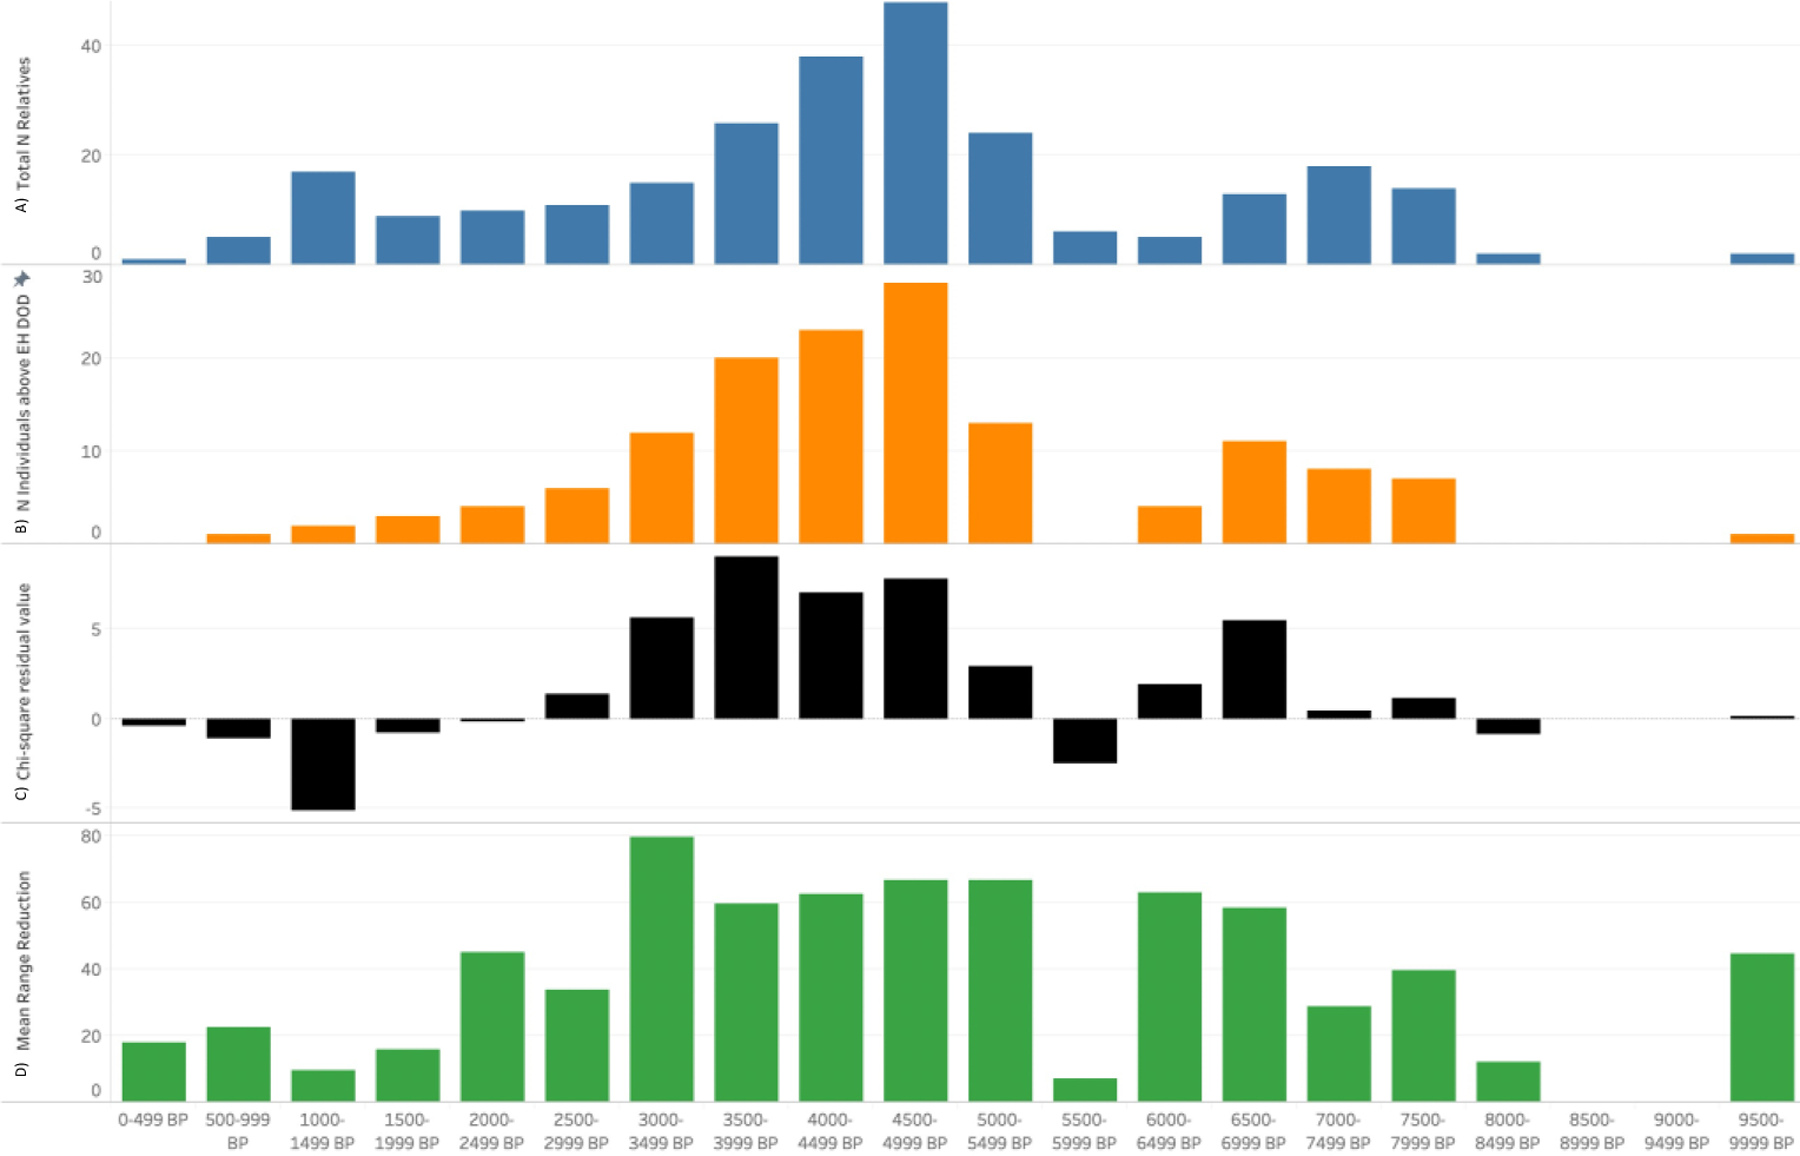
Data from the database and 264 individuals with relatives binned in 500-year intervals. A) #of individuals total in each 500-year interval. B) # of relatives per interval with reductions that exceed GH DOD estimates C) Residuals from chi-squared test of significance for individuals with reductions above GH DOD estimates D) Mean reduction of all relatives per 500 year-bin using OxCal’s interval function