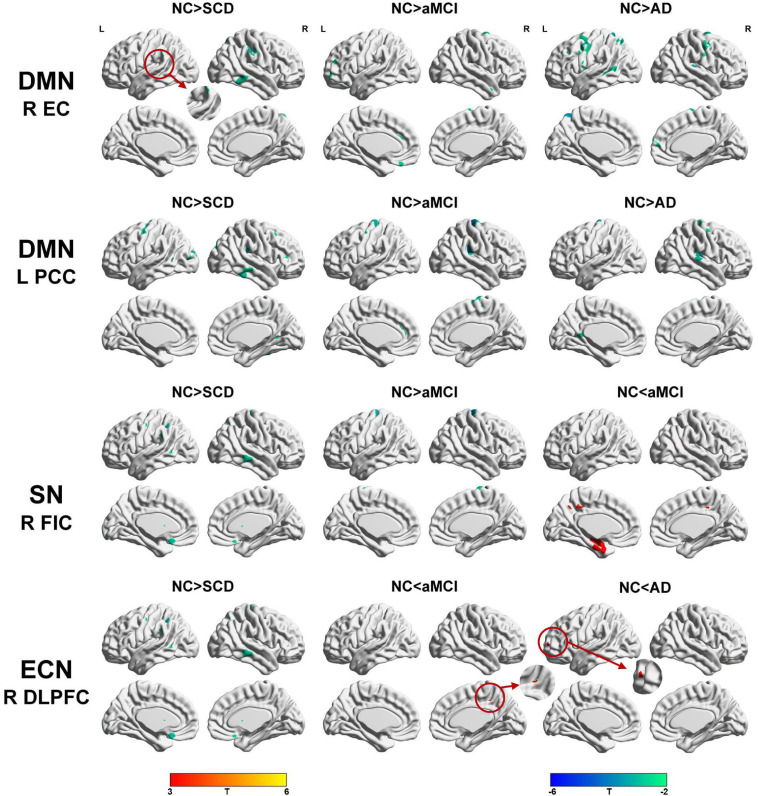
FIGURE 4.
Between-group (NC-SCD; NC-aMCI; and NC-AD) differences in structural covariance networks seeding from the default mode network, salience network, and executive control network. T-statistic maps, p < 0.01 at the voxel level and p < 0.05 at the cluster level, two-tailed Gaussian random field (GRF) correction with cluster size larger than 100 voxels. The small clusters are circled by the red circles, and they are enlarged. L, left; R, right; EC, entorhinal cortex; PCC, posterior cingulate cortex; DLPFC, dorsolateral prefrontal cortex; FIC, frontoinsular cortex; AD, Alzheimer’s disease; NC, normal control; aMCI, amnestic mild cognitive impairment; SCD, subjective cognitive decline.

