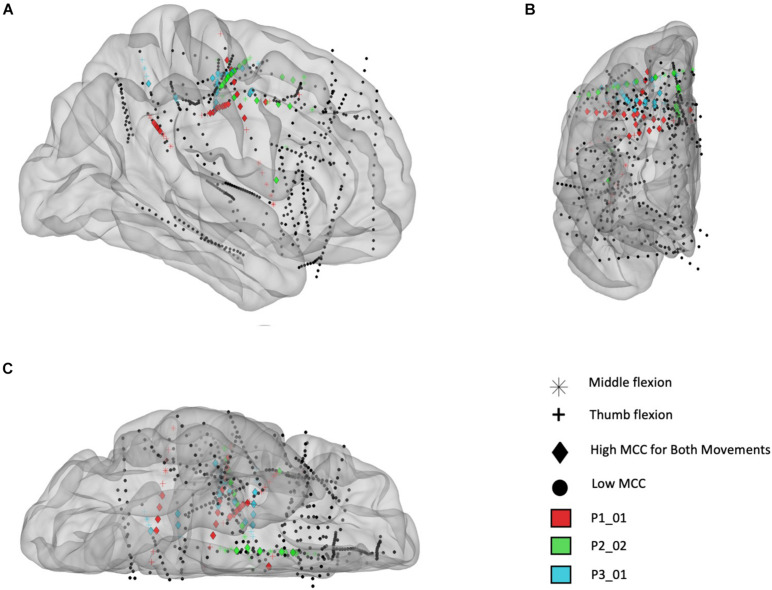
FIGURE 7.
Electrode locations (right hemisphere) mapped to standard brain based on the Yeo 7 atlas for participants P1_01 (red), P2_02 (green), and P3_01 (blue). (A) Sagittal view from lateral perspective. (B) Coronal view from anterior perspective. (C) Transverse view from inferior perspective. The colored electrodes had high temporal correlation (MCC > 0.6) during a cued finger task including sustained thumb and middle flexion movements, separately, and the symbols mark which movement(s) had high MCC values: thumb flexion (cross), middle finger flexion (asterisk), or both (diamond). Note: electrodes are sometimes not inserted fully by the surgeon, therefore some contacts are located outside the brain (as seen in this figure).

