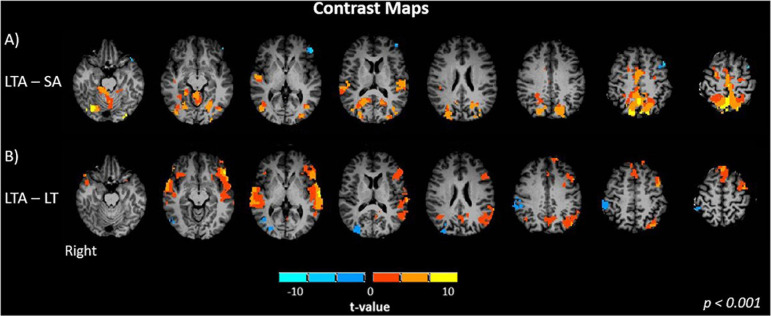
FIGURE 4.
Brain activation maps of contrast between task factors: (A) LTA – SA, Left turns with oncoming traffic and audio vs. straight driving with audio; and (B) LTA – L, left turns with oncoming traffic and audio vs. left turns with oncoming traffic without audio. Activations are shown with a statistical significance threshold of p < 0.001. “Right” indicates the right cerebral hemisphere.

