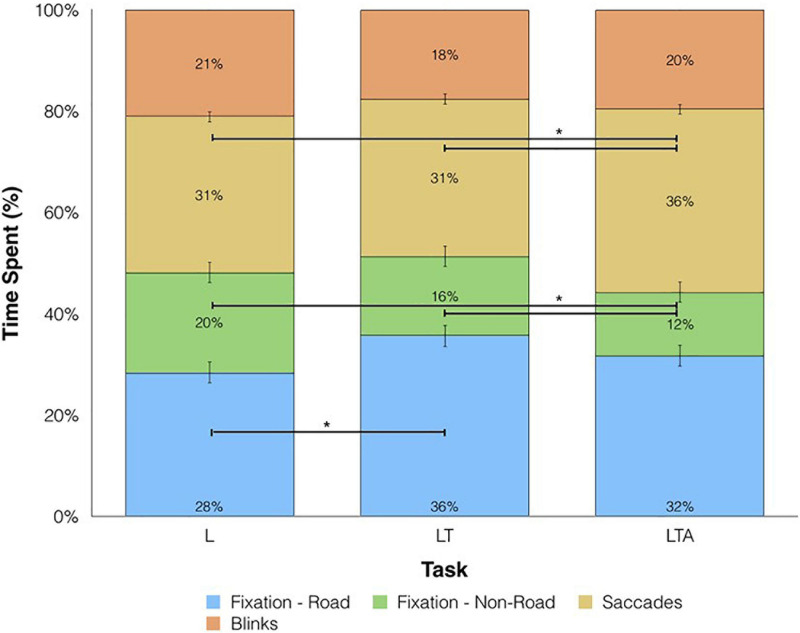
FIGURE 6.
Percentage of time spent on eye movements for L, left turns; LT, left turns with oncoming traffic; and LTA, left turns with oncoming traffic and auditory distraction. Fixations on the road are shown in blue, fixations away from the road are shown in green, saccades are shown in yellow and blinks are shown in orange. Horizontal bars and asterisks represent statistically significant differences at p < 0.05.

