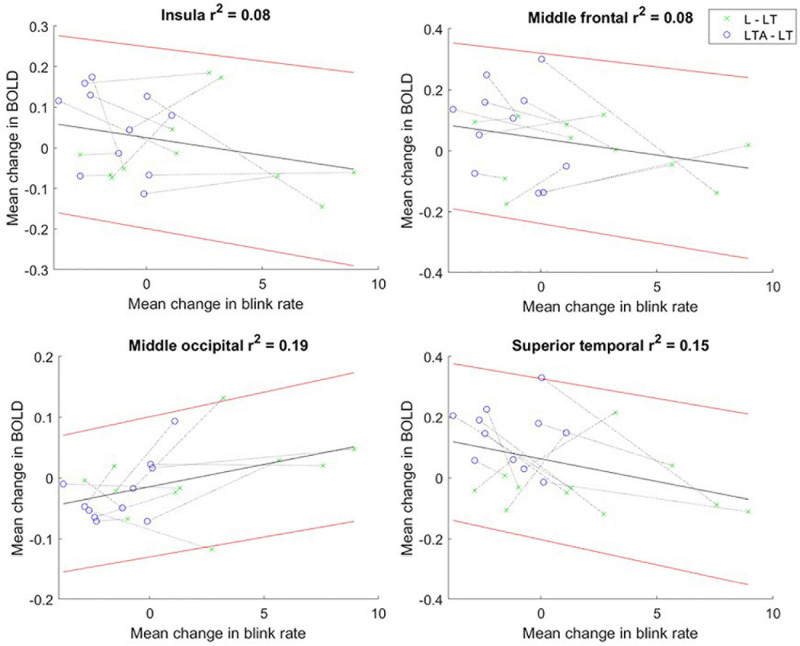
FIGURE 7.
Mean change in BOLD fMRI signal vs. mean change in blink rate for “L – LT” (green) and “LTA – LT” (blue) task contrasts for the insula, and regions of interest in the middle frontal, middle occipital and superior temporal gyri. The dotted line connects the data points for each participant. The linear regression line is shown in black, with the 95% confidence interval for the regression line shown in red. BOLD, blood oxygenation level dependent; L, left turns; LT, left turns with oncoming traffic; LTA, left turns with oncoming traffic and auditory distraction.

