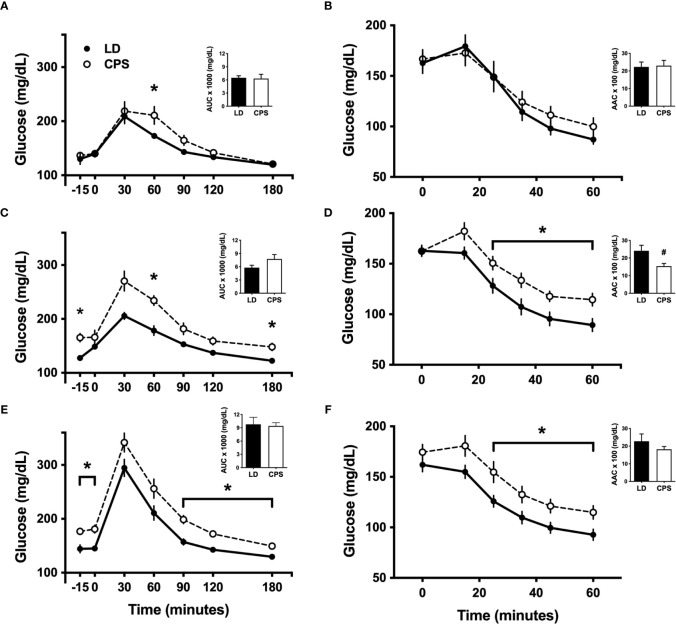
Figure 3.
Effects of gestational chronic phase shift of photoperiod on intraperitoneal glucose tolerance test (A, C, E) and intraperitoneal insulin tolerance test (B, D, F) of rats fed with 45% high-fat diet (HFD) for 12 weeks, measured at week 0/basal (A, B), 6 weeks (C, D) and 12 weeks (E, F). Data are mean ± SEM. Solid line: LD, adult rats that had been gestated under control 12:12 (LD) photoperiod; dashed line: CPS, adult rats that had been gestated under chronic phase shift (CPS) photoperiod. AUC, Area under the curve; AAC, Area above the curve. n = 8 per group. *different from LD (p < 0.05 pairwise comparison at each time point with Bonferroni correction), #different from LD (p < 0.05, unpaired t-test).

