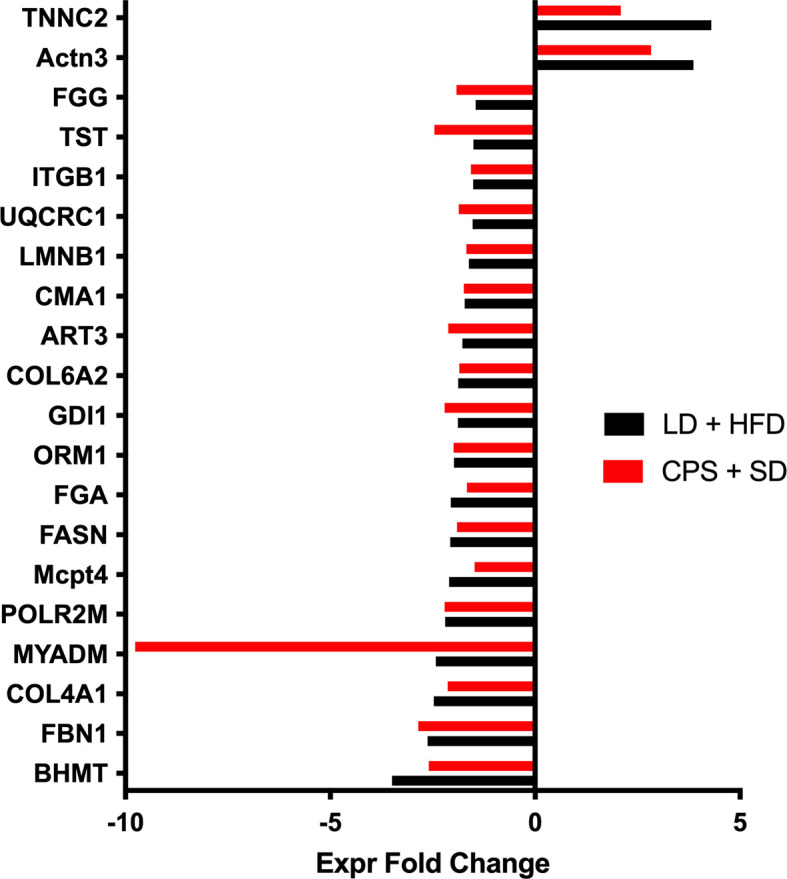
Figure 9.

Up and down expressed proteins in WAT from adult offspring gestated under control conditions and fed with high-fat diet during 12 weeks from postnatal day 100 onwards (LD + HFD group—black bar) and adult offspring gestated under CPS conditions and fed with standard diet postnatally (CPS + SD). Fold change in CPS + SD offspring is shown in red, and that of LD + HFD is in black. Data are expressed as mean of fold changes and were analyzed using Ingenuity Pathways Analysis (IPA).
