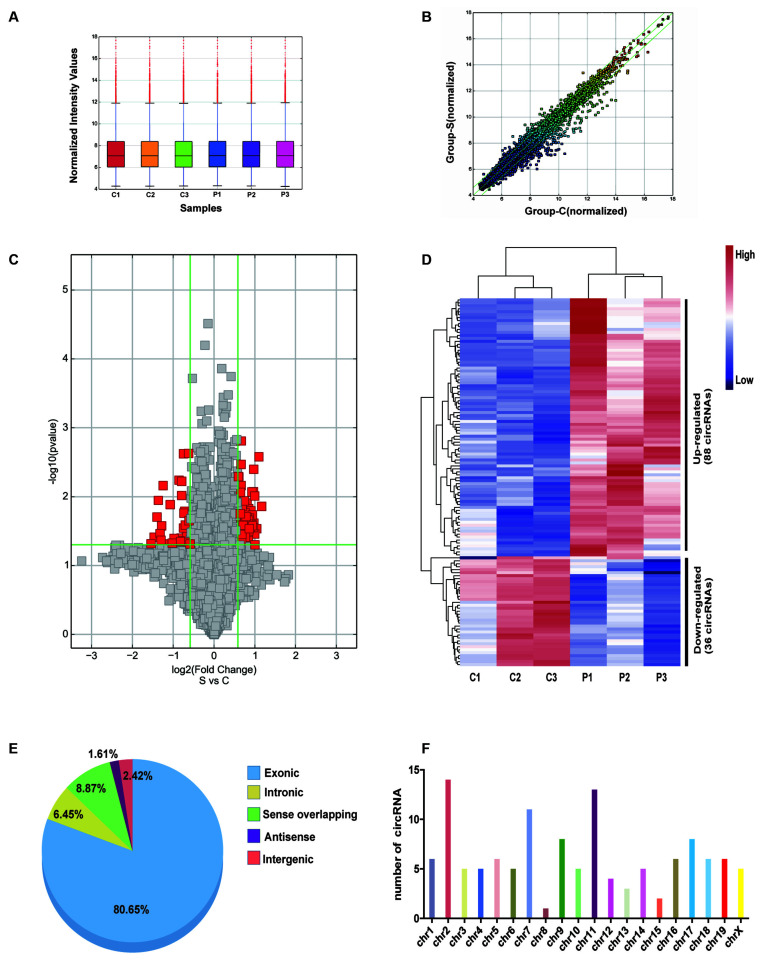
Figure 2.
Character of differentially expressed circRNA in the postoperative cognitive dysfunction (POCD) and control groups. (A) Distribution of circRNAs in the six samples (C1–3: control group; P1–3: POCD group). (B) The difference expression of circRNA is shown by a scatter plot between the control and POCD groups. (C) The differential circRNA expression is shown by volcano diagrams between the control and POCD groups. (D) Thirty-six downregulated and 88 upregulated circRNAs in POCD are shown in the heatmap. (E) The pie chart showed the transcriptional sources of the differentially expressed circRNAs. (F) Chromosome locations of the differentially expressed circRNAs.

