Figure 7.

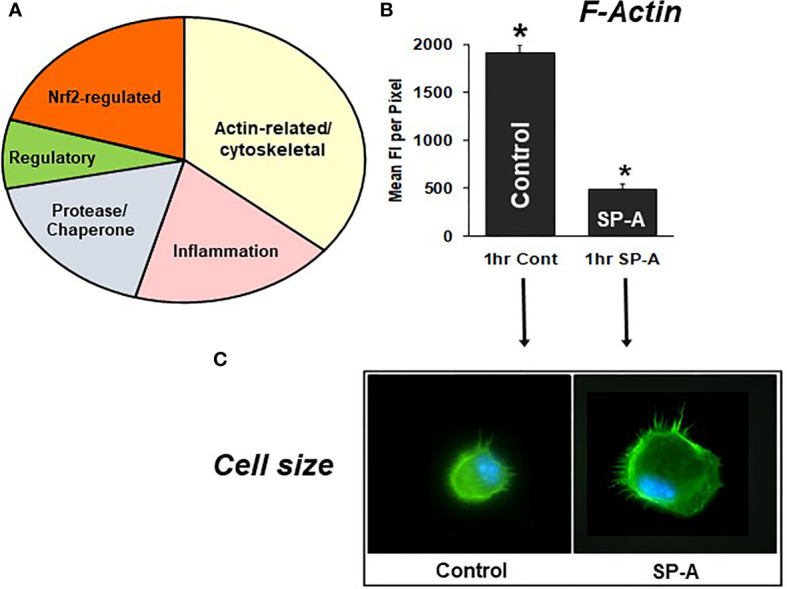
SP-A rescue of the SP-A KO AM. (A) depicts the groups of proteins that changed in response to SP-A. (B) depicts the mean fluorescence per pixel of F-actin (cells stained with Alexa Fluor 488 phalloidin) after 1hr of treatment with SP-A (1hr SP-A) or untreated (1hr control) SP-A KO AM (105). (C) depicts the actual fluorescence in the control and SP-A-treated AM as well as the size change after the treatment (110). AMs were visualized using a Nikon TE-2000 PFS fluorescent microscope with a 60X (1.4 NA) phase contrast lens with a 1.5× tube lens in place and the images captured using a Photometrics Coolsnap HQ2 digital camera (0.07 μm/pixel) and saved as TIFF files (105). *p < 0.0001.
