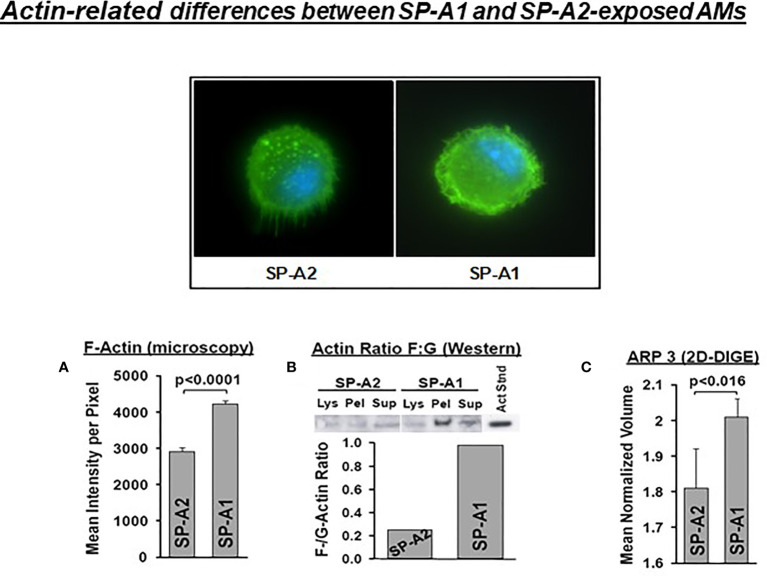
Figure 9.
Actin-related differences between SP-A1 and SP-A2-exposed AM (110). The pattern of fluorescence (cells stained with AlexaFluor 488 phalloidin) of AM exposed chronically to SP-A2 or SP-A1 is shown and it is not identical. (A) depicts the mean intensity of fluorescence per pixel and shows significant differences between SP-A2 and SP-A1 AM. (B) shows the ratio (densitometric measurements) of F-actin to G-actin in different cell fractions from a Western blot stained with an anti-actin N-terminal antibody (Sigma #2103). This ratio is lower in SP-A2 AM. (C) depicts significant differences between SP-A1 and SP-A2 in the levels of ARP3 obtained from proteomics data. Arp3 regulates actin polymerization and is part of the Arp2/3 complex, where several signaling pathways leading to actin polymerization converge.

