Figure 1.

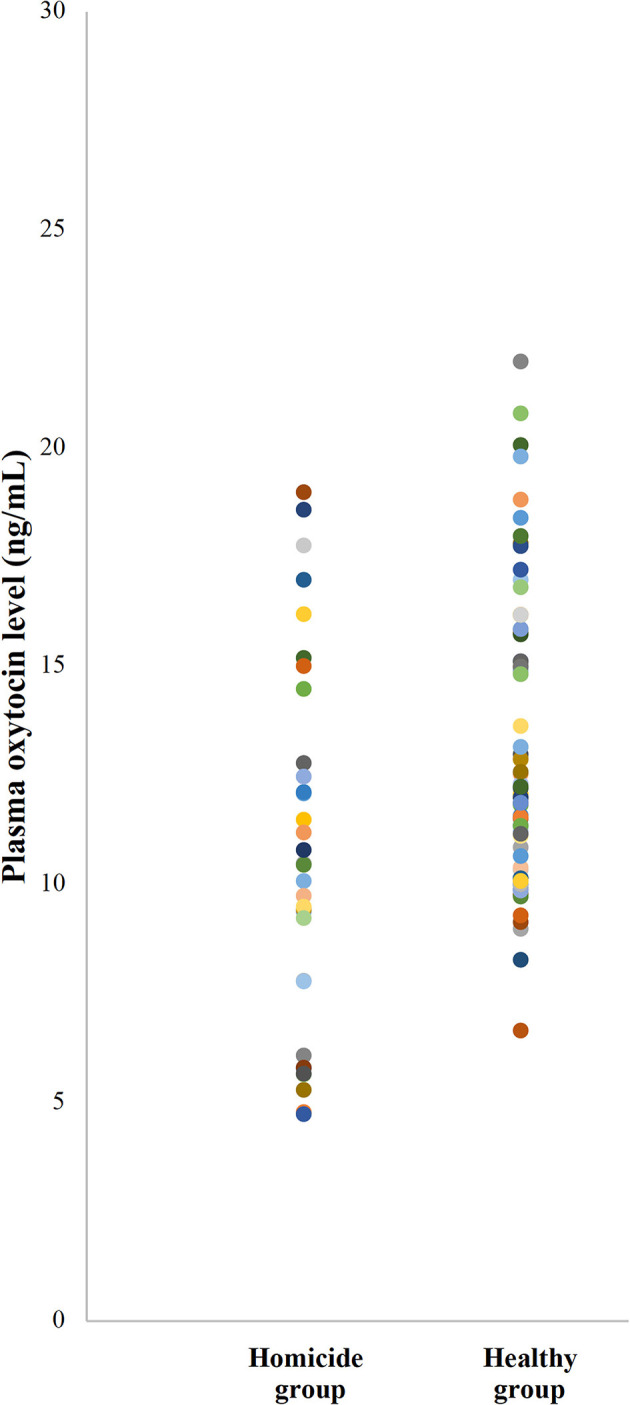
Scatter plot illustrating the plasma oxytocin levels of participants in homicide groups and healthy groups. Each color dot represents the plasma level of oxytocin of each participant.

Scatter plot illustrating the plasma oxytocin levels of participants in homicide groups and healthy groups. Each color dot represents the plasma level of oxytocin of each participant.