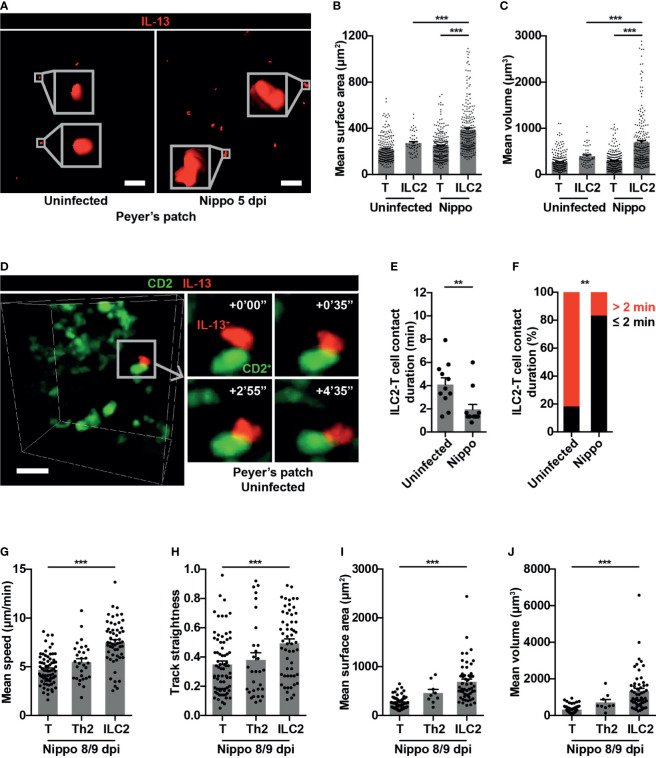
Figure 3.
PP ILC2s show changes in size and cellular interactions following helminth infection. (A) Examples of cell size of PP ILC2s, uninfected and 5 dpi; scale bar 50 µm, Z 48 µm. (B, C) Quantification of (B) mean surface area and (C) mean volume of T cells and ILC2s, uninfected and 5 dpi; ***p < 0.001. Pooled data from 6-9 movies from 3 mice per condition, each dot representing one cell track. (D) Intravital example of ILC2-T cell interaction in uninfected PP; scale bar 20 µm, Z 48 µm. (E) Quantification of ILC2-T cell contact duration (min), each dot representing one interaction; **p < 0.01. (F) Quantification of proportions of ILC2-T cell contacts > 2 or ≤ 2 minutes; **p < 0.01 by Fisher’s test. Pooled data from 6-7 movies from 3 mice per condition. (G–J) Quantification of (G) mean speed, (H) track straightness, (I) mean surface area and (J) mean volume of CD2+ T cells, CD2+IL-13+ Th2 cells and IL-13+ ILC2s, 8/9 dpi; ***p < 0.001 ILC2 vs T. Pooled data from 3 movies, each dot representing one cell track.

