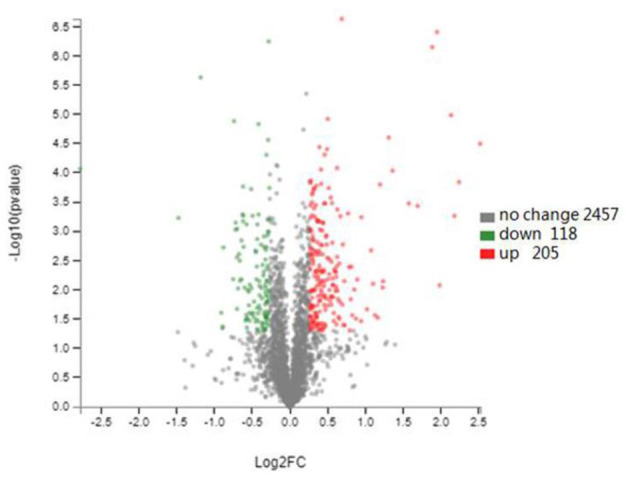
Figure 5.

Changes in the E. coli K12 proteome after ybfA deletion. Volcano plots of 2780 identified proteins are shown. The colors indicate the fold changes. Red represents proteins with the fold changes greater than 1.20, and green represents proteins with the fold changes <0.83 (P < 0.05).
