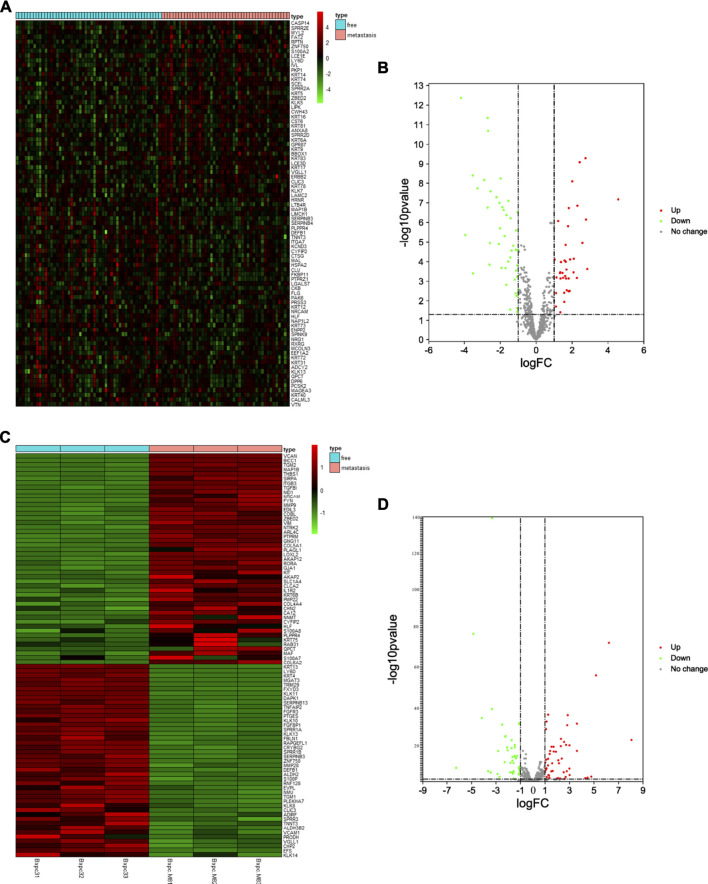
FIGURE 2.
Identification of Differentially Expressed EMT-related Genes (A, C) The heat map of DEGs in pancreatic cancer from TCGA dataset and BxPC-3-M8 and BxPC-3 cells (p-value < 0.05 and |log FC| > 1). Red color indicates up-regulated genes, and green indicates down-regulated genes (B, D) The volcano plot of DEGs in pancreatic cancer from TCGA dataset (B) and BxPC-3-M8 and BxPC-3 cells (D). The red dots and green dots represent upregulated DEGs and downregulated DEGs with significance (p-value < 0.05 and |log FC| > 1), respectively. The gray dots are those DEGs without significance.

