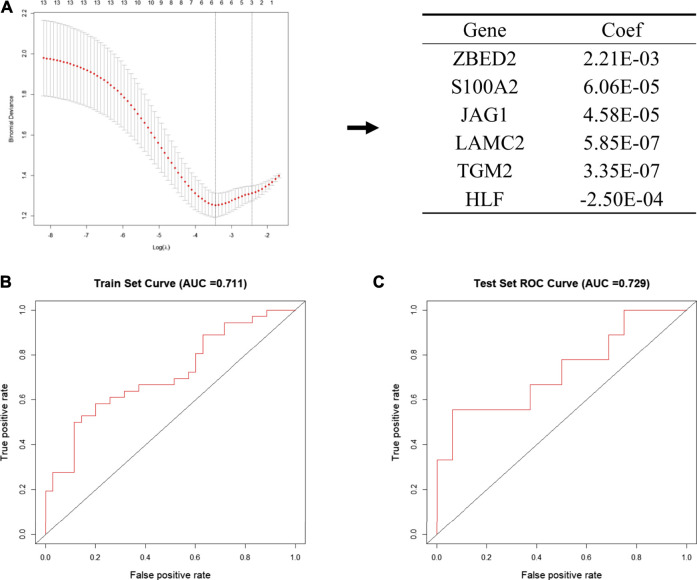
FIGURE 4.
Establishment of the metastatic signature based on the six selected genes (A) Schematic representation of the model building process. In the left pane, the 13 genes that were used to construct the models are shown, among six genes were selected according to the minimum binomial deviance. The right panel shows the coefficients of six genes screened by Lasso (B, C) The ROC curve of risk signature of train set (B) and test set (C) of LASSO risk scoring model.

