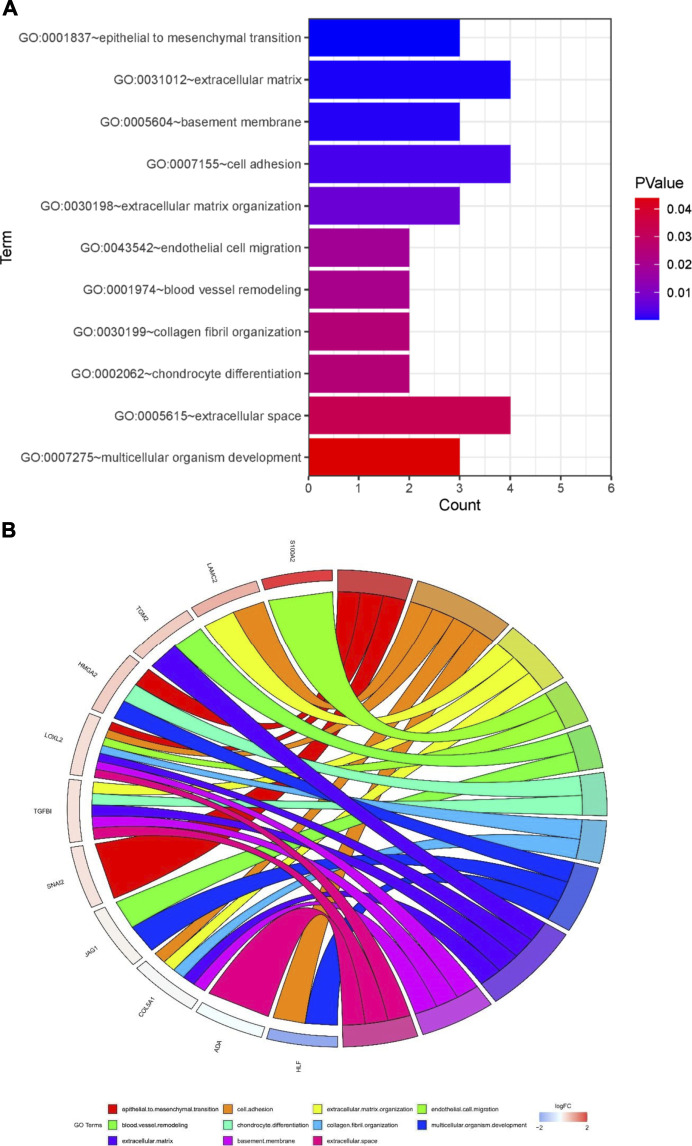
FIGURE 5.
Potential mechanisms associated with tumor metastasis (A) GO enrichment analysis of overlapping differentially expressed genes (DEGs) (B) Gene Ontology (GO) analysis of 13 epithelial-mesenchymal transition related genes. Analyses are shown in a chord plot, in which the left side represents the 13 selected genes, and the right side shows the GO enrichment pathway of the selected genes. Genes were ranked from large to small according to the change of log FC expression in the sample. The upper side represent up-regulated genes, and the lower side depicts down-regulated genes. Different colors represent different clusters in GO terms.

