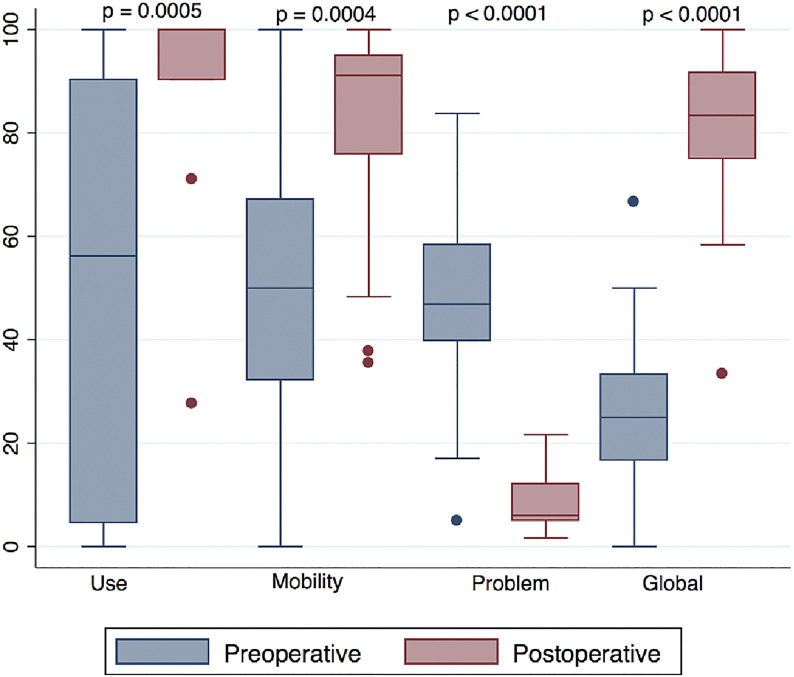
Fig. 2.
Box plots of the preoperative (blue) and postoperative (red) Q-TFA domains. The top and bottom of the box indicate the interquartile range (IQR), the line within the box indicates the median, the whiskers indicate the minimum and maximum values, and the circles indicate outliers (values less than the first quartile – 1.5 × IQR or greater than the third quartile + 1.5 × IQR).

