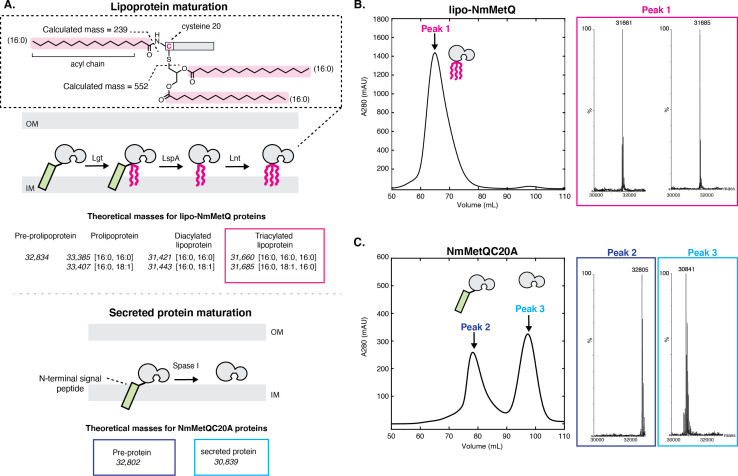
Figure 1. Mass spectrometry (MS) analysis of lipo-NmMetQ and NmMetQC20A proteins.
(A) (Top) Schematic of lipoprotein maturation pathway. Inset contains a schematic of a lipoprotein with acyl chain composition [16:0,16:0,16:0]. Acyl chains are grouped in a dotted line box and their average masses are calculated. Below the schematic are the theoretical masses for the lipo-NmMetQ proteins (in italics) assuming triacylation occurs via the canonical lipoprotein maturation pathway due to the sequential action of three enzymes (Lgt, LspA, and Lnt). The numbers in the brackets correspond to the total number of carbons and double bonds, respectively, present in the fatty acyl chains of the lipid. (Bottom) Schematic of various NmMetQC20A proteins with example theoretical average masses, shown in italics, assuming cleavage occurs between A19 and A20, possibly by signal peptidase I (SPase I). N-terminal signal peptides are represented by a green rectangle. (B) Characterization of lipo-NmMetQ. Size-exclusion chromatogram and mass spectra of peak 1. The molecular masses of the major species correspond within 1 Da to the predicted mass for two triacylated NmMetQ species, one with acyl chain composition [16:0, 16:0, 16:0] (31,661 Da) and the other with [16:0, 16:0, 18:1] (31,685 Da). (C) Characterization of NmMetQC20A. Size-exclusion chromatogram and mass spectra of the major species from peak 2 and peak 3. The molecular masses of the major species of peak 2 and 3 correspond to the pre-protein NmMetQ (32,802 Da) and secreted NmMetQ (30,839 Da), respectively. These measured masses are within 3 Da of the predicted masses for each species. Assigned NmMetQ species are depicted in cartoon form on the chromatograms.


