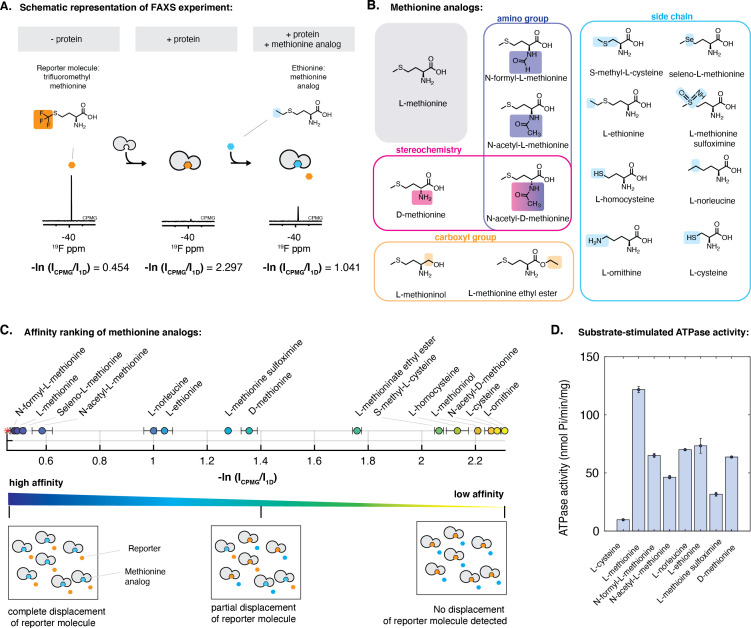
Figure 3. Characterization of the interaction of methionine analogs with NmMetQ using FAXS and ATPase experiments.
(A) Schematic diagram of the FAXS experiment. The intensity of the fluorine signal decreases in the presence of NLM-NmMetQ. Addition of the methionine analog causes the fluorine signal intensity of the reporter molecule to increase due to its displacement from NLM-NmMetQ. (B) Chemical structures of the methionine analogs used in this study. (C) (Top) Ordering of methionine analogs by their binding affinity to NLM-NmMetQ. (Bottom) Schematic representation of FAXS experiment depicted in bulk solution. Methionine analogs with higher affinity are positioned toward the left side of the plot, while lower affinity methionine analogs are positioned toward the right. (D) ATPase activity of NmMetNI at 2 mM ATP in the presence of lipo-NmMetQ and methionine analogs at 1:8:50 molar ratio, respectively. N=3 error bars represent SEM.

