. 2021 Aug 19;10:e69742. doi: 10.7554/eLife.69742

Figure 4. Architecture of NmMetNI and lipo-NmMetQ:NmMetNI complex.

(A) The 3.3 Å resolution cryo-EM map and NmMetNI in the inward-facing conformation in two views. (B) Transmembrane localization of NmMetI, showing NmMetI contains five transmembrane helices per monomer (C) The 6.4 Å resolution cryo-EM map and model of NmMetNI in complex with lipo-NmMetQ in the presence of ATP. NmMetNI is in the outward-facing conformation. NmMetI is shown in light/dark blue, NmMetN in light/dark grey and lipo-NmMetQ in light pink. The membrane is represented by a gray box.

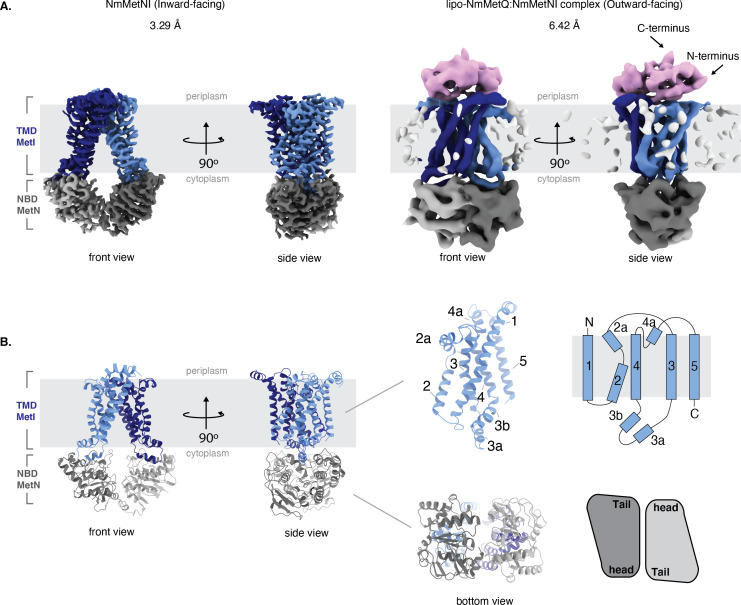
Figure 4.

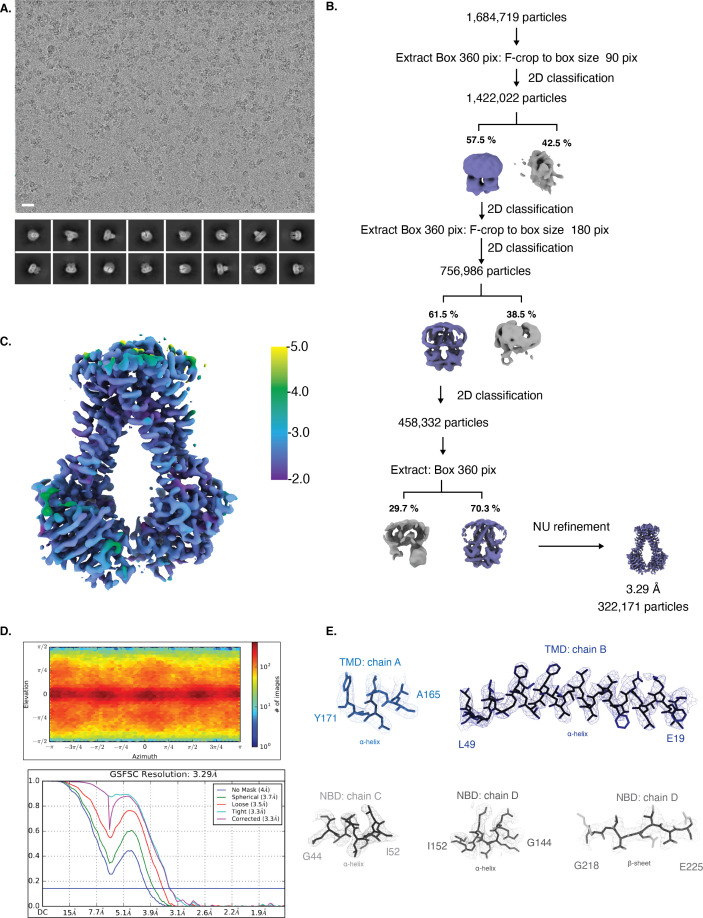
Figure 4—figure supplement 1. Cryo-EM map generation and data processing refinement of NmMetNI in the inward-facing conformation.

Figure 4—figure supplement 1.

Cryo-EM map generation and data processing refinement of NmMetNI in the inward-facing conformation. (A) Representative cryo-EM micrograph of (scale bar is 20 nm) and select 2D class averages. (B) Workflow of single-particle image processing. (C) Local resolution plot of NmMetNI as calculated using cryoSPARC. (D) Angular distribution calculated for particle projections. Heatmap shows number of particles for each viewing angle (top) and gold-standard Fourier shell correlation (FSC) curves for masked and unmasked maps generated by cryoSPARC non-uniform refinement (bottom) (E) Cryo-EM density (mesh) overlaid on the atomic model of select regions of NmMetNI (sticks).
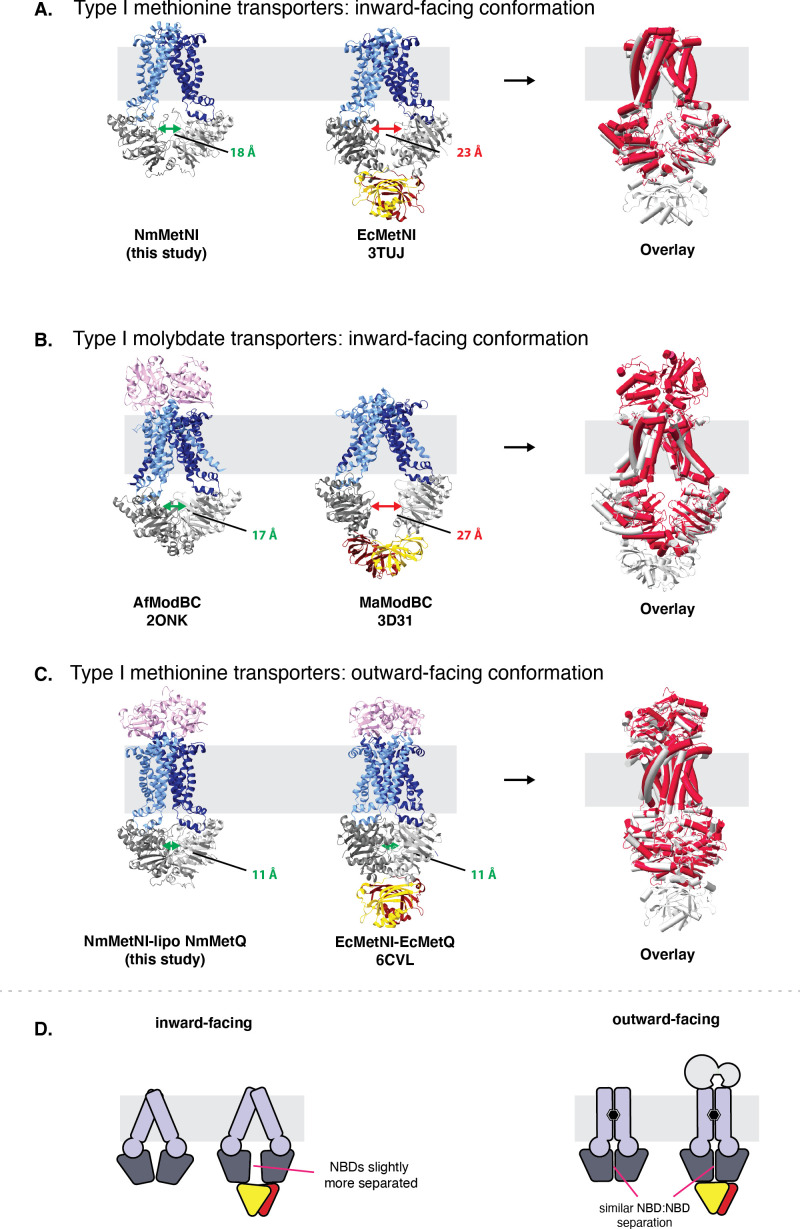
Figure 4—figure supplement 2. Comparison of type I ABC transporters.

Figure 4—figure supplement 2.

Comparison of type I ABC transporters. (A) ABC methionine transporters in the inward-facing conformation. (B) ABC molybdate transporters in the inward-facing conformation and (C) ABC methionine transporters in the outward-facing conformation. For each model the TMDs, NBDs, and SBPs, are colored in blue, grey, and pink, respectively. Next to each panel, an overlay is included of the two structures, with the ABC transporter with a regulatory domain colored in grey and the ABC transporter with a regulatory domain colored in red. NBD:NBD inter-subunit distances were assessed using the Cα of NBD glycine residues in the P loop and signature motifs. The average of the two distances are indicated by double arrows. (D) Schematic summary for NBD:NBD distances of homologous methionine ABC transporters with and with out the autoinhibitory domain in the inward and outward-facing conformations, respectively.
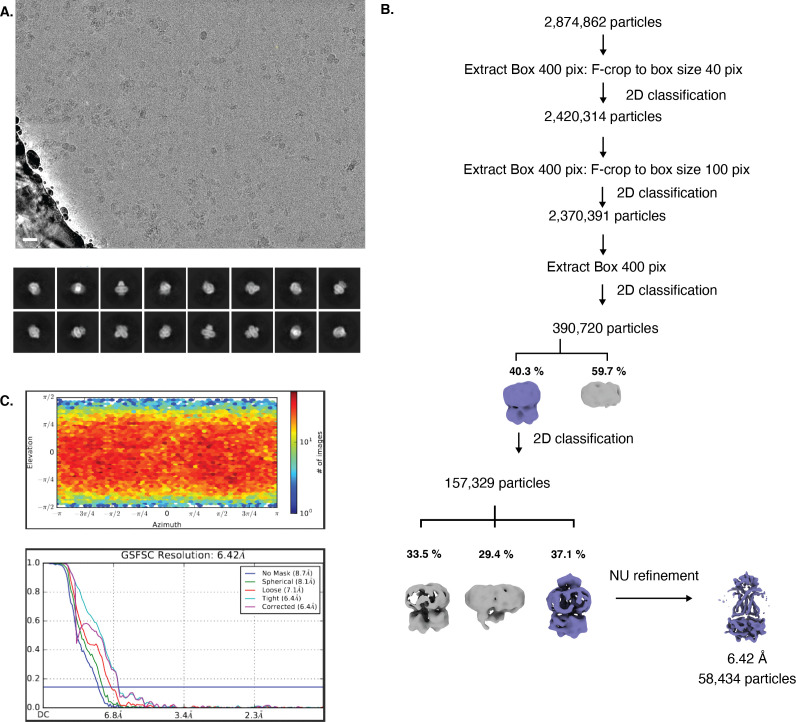
Figure 4—figure supplement 3. Cryo-EM map generation and data processing refinement of lipo-NmMetQ:NmMetNI complex in the outward-facing conformation.

Figure 4—figure supplement 3.

Cryo-EM map generation and data processing refinement of lipo-NmMetQ:NmMetNI complex in the outward-facing conformation. (A) Representative cryo-EM micrograph of (scale bar is 20 nm) and select 2D class averages. (B) Workflow of single-particle image processing. (C) Angular distribution calculated for particle projections. Heatmap shows number of particles for each viewing angle (top) and gold-standard Fourier shell correlation (FSC) curves for masked and unmasked maps generated by cryoSPARC non-uniform refinement (bottom).