. 2021 Aug 24;10:e69498. doi: 10.7554/eLife.69498

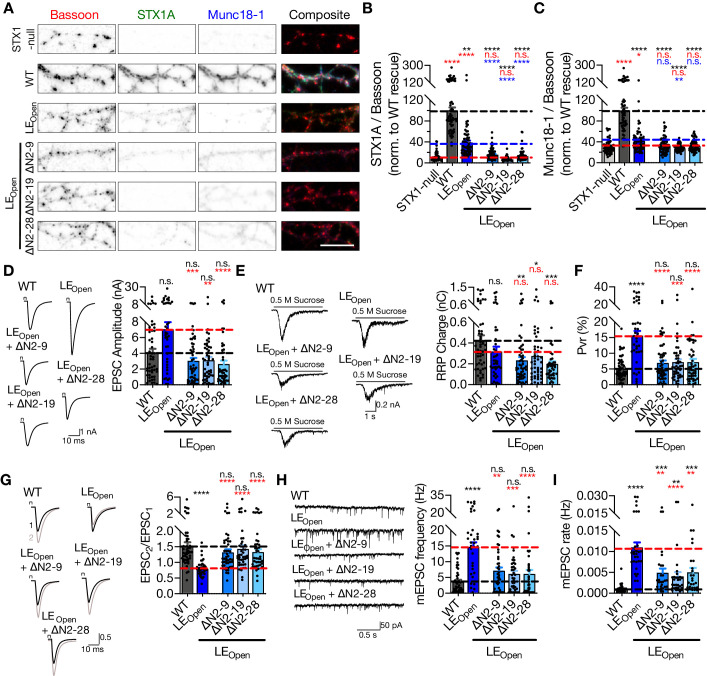
Figure 4. ‘Opening’ of STX1A in combination with the deletion of its entire N-terminal stretch does not impair neurotransmitter release.

(A) Example images of immunofluorescence labeling for Bassoon, STX1A, and Munc18-1 shown as red, green, and blue, respectively, in the corresponding composite pseudocolored images obtained from high-density cultures of STX1-null hippocampal neurons either not rescued or rescued with STX1AWT, STX1ALEOpen, STX1ALEOpen + ∆N2-9, STX1ALEOpen + ∆N2-19, or STX1ALEOpen + ∆N2-28. Scale bar: 10 µm (B, C) Quantification of the immunofluorescence intensity of STX1A and Munc18-1 as normalized to the immunofluorescence intensity of Bassoon in the same ROIs as shown in (A). The values were then normalized to the values obtained from STX1AWT neurons. (D) Example traces (left) and quantification of the amplitude (right) of EPSCs obtained from hippocampal autaptic STX1AWT, STX1ALEOpen, STX1ALEOpen + ∆N2-9, STX1ALEOpen + ∆N2-19, or STX1ALEOpen + ∆N2-28 neurons. (E) Example traces (left) and quantification of the charge transfer (right) of sucrose-elicited readily releasable pools (RRPs) obtained from the same neurons as in (D). (F) Quantification of probability of vesicular release (Pvr) determined as the percentage of the RRP released upon one action potential (AP). (G) Example traces (left) and quantification (right) of paired-pulse ratio (PPR) measured at 40 Hz. (H) Example traces (left) and quantification of the frequency (right) of mEPSCs. (I) Quantification of mEPSC rate as spontaneous release of one unit of RRP. (I) Quantification of mEPSC rate as spontaneous release of one unit of RRP.

Figure 4—source data 1. Quantification of lentiviral expression of STX1ALEOpen and STX1ALEOpen + ΔΝ mutants in STX1-null neurons and the consequent neurotransmitter release properties.

Figure 4.

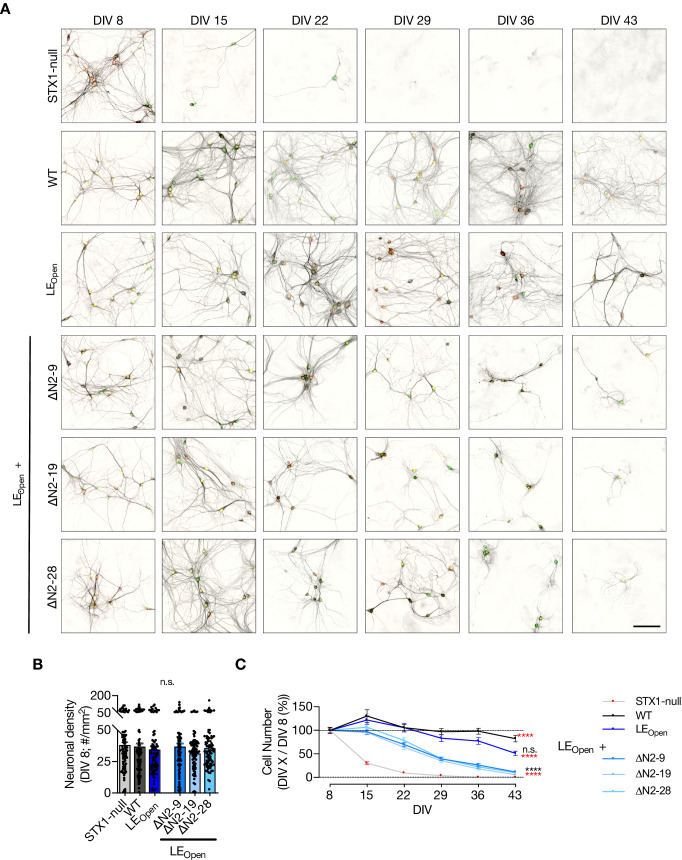
Figure 4—figure supplement 1. Interruption of both Munc18-1 binding modes of STX1 ultimately leads to neuronal death.

Figure 4—figure supplement 1.

(A) Example images of high-density cultures of STX1-null hippocampal neurons at DIV 8, 15, 22, 29, 36, and 43 represented with immunofluorescent labeling of microtubule associated protein 2 (MAP2). Red and green nuclei serve as a marker for NLS-RFP-P2A-Cre recombinase expression and for NLS-GFP-P2A-STX1A (either WT or mutants), respectively. 50 µm. (A) Quantification of neuronal density at DIV 8 in STX1-null hippocampal neurons either not rescued or rescued with STX1AWT, STX1ALEOpen, STX1ALEOpen + ∆N2-9, STX1ALEOpen + ∆N2-19, or STX1ALEOpen + ∆N2-28. Scale bar: 10 µm (B) Quantification of the percentage of the surviving neurons at DIV 8, 15, 22, 29, 36, and 43 as normalized to the neuronal density at DIV 8. Data information: in (B), data points represent single observations, the bars represent the mean ± SEM. In (C), data points represent the mean ± SEM. Red and black annotations (stars and n.s.) on the graphs show the significance comparisons to STX1-null and to STX1AWT rescue, respectively (nonparametric Kruskal–Wallis test followed by Dunn’s post hoc test, *p≤0.05, **p≤0.01, ***p≤0.001, ****p≤0.0001). The number of observations and cultures and statistical data are summarized in Figure 4—source data 1. The numerical values are summarized in Figure 4—figure supplement 1—source data 1.
Figure 4—figure supplement 1—source data 1. Quantification of neuronal density of neurons expressing STX1ALEOpen or STX1ALEOpen + ΔΝ mutants at different time intervals.
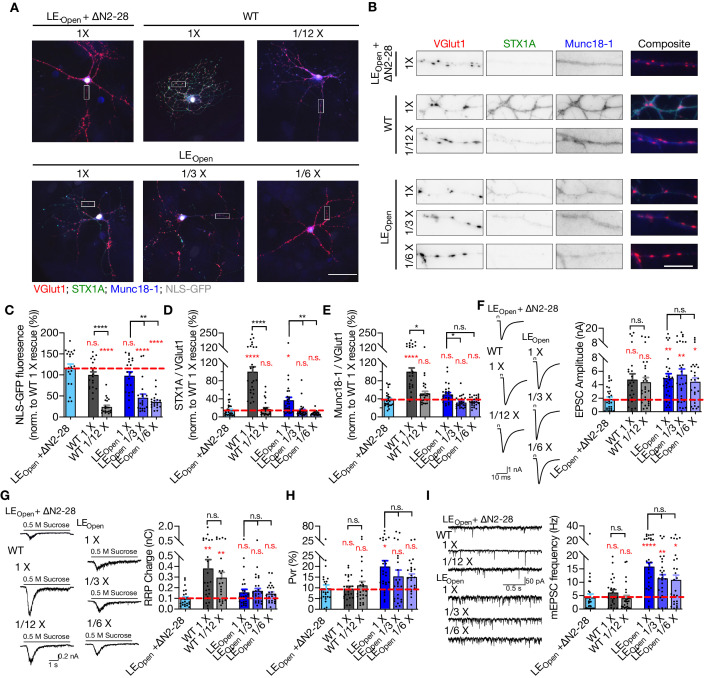
Figure 4—figure supplement 2. Reducing the expression levels of STX1AWT or STX1ALEOpen does not alter their synaptic release properties.

Figure 4—figure supplement 2.

(A) Example images of immunofluorescence labeling for VGlut1, STX1A, Munc18-1, and NLS-GFP shown as red, green, blue, and gray, respectively, in autaptic STX1-null hippocampal neurons rescued with 1× viral volume of STX1ALEOpen + ∆N2-28 as reference or with different viral volumes of either STX1AWT, or STX1ALEOpen as. Scale bar: 50 µm. (A) Higher magnification images of the areas highlighted in the images in (A). VGlut1, STX1A, and Munc18-1 are shown as red, green, and blue, respectively, in the corresponding composite image. Scale bar: 10 µm. (B) Quantification of the fluorescence intensity of NLS-GFP from the neurons as in (A) as normalized to that of STX1AWT 1× rescue. (C) Quantification of the immunofluorescence intensity of STX1A as normalized to the immunofluorescence intensity of Bassoon in the same ROIs as shown in (B). The values were then normalized to the values obtained from STX1AWT 1× neurons. (D) Quantification of the immunofluorescence intensity of Munc18-1 as normalized to the immunofluorescence intensity of Bassoon in the same ROIs as shown in (B). The values were then normalized to the values obtained from STX1-null neurons expressing STX1AWT 1× neurons. Example traces (left) and quantification of the amplitude (right) of EPSCs obtained from hippocampal autaptic STX1-null neurons rescued with 1× viral volume of STX1ALEOpen + ∆N2-28 as reference or with different viral volumes of either STX1AWT, or STX1ALEOpen. The artifacts are blanked in the example traces. (E) Example traces (left) and quantification of the charge transfer (right) of sucrose-elicited readily releasable pools (RRPs) obtained from the same neurons as in (F), (G) Quantification of probability of vesicular release (Pvr) determined as the percentage of the RRP released upon one action potential. (H) Example traces (left) and quantification of the frequency (right) of mEPSCs recorded at –70 mV. The example traces were filtered at 1 kHz. Data information: in (C–I), data points represent single observations, the bars represent the mean ± SEM. Red annotations (stars and n.s.) on the graphs show the significance comparisons to STX1ALEOpen + ∆N2-28 1× rescue. Black annotations (stars and n.s.) on the bars show the significance comparisons for rescues using different viral volume either for STX1AWT or STX1ALEOpen. (nonparametric Kruskal–Wallis test followed by Dunn’s post hoc test, *p≤0.05, **p≤0.01, ***p≤0.001, ****p≤0.0001). The numerical values are summarized in Figure 4—figure supplement 2—source data 1.
Figure 4—figure supplement 2—source data 1. Quantification of the effects lentiviral downtitration of STX1AWT and STX1ALEOpen on STX1A's and Munc18-1's expression levels and on neurotransmitter release parameters.
Figure 4—figure supplement 3. Exogenous expression of STX1A using 1× volume of lentiviral particles is approximately threefold higher than endogenous STX1A expression.
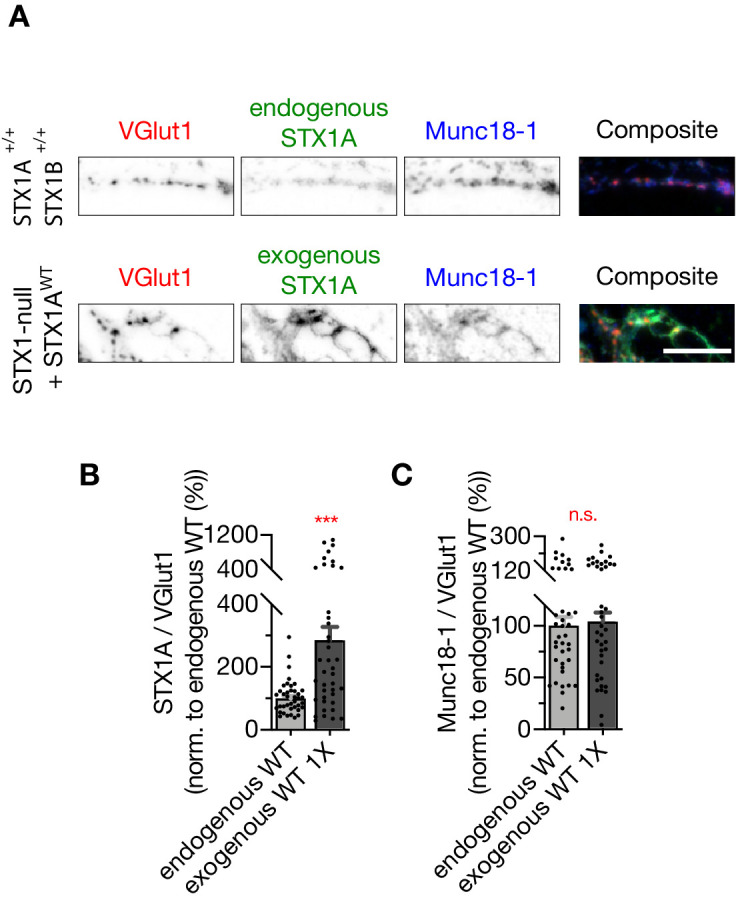
Figure 4—figure supplement 3.

(A) Example images of immunofluorescence labeling for VGlut1, STX1A, and Munc18-1. Scale bar: 10 µm. (B) Quantification of the immunofluorescence intensity of STX1A as normalized to the immunofluorescence intensity of Bassoon in the same ROIs as shown in (A). The values were then normalized to the values obtained from WT neurons. (C) Quantification of the immunofluorescence intensity of Munc18-1 as normalized to the immunofluorescence intensity of Bassoon in the same ROIs as shown in (A). The values were then normalized to the values obtained from WT neurons. Data information: in (B, C), data points represent single observations, the bars represent the mean ± SEM. Red annotations (stars and n.s.) on the graphs show the significance comparisons of endogenous STX1A vs. exogenous STX1A using 1× viral volume. (Mann–Whitney test, ***p≤0.001). The numerical values are summarized in Figure 4—figure supplement 3—source data 1.
Figure 4—figure supplement 3—source data 1. Comparison of the lentiviral expression of STX1A with its endogenous expression.