. 2021 Aug 24;10:e69498. doi: 10.7554/eLife.69498

Figure 6. STX1A’s N-peptide has a modulatory function in short-term plasticity and Ca2+-sensitivity of synaptic transmission.

(A) Example traces (left) and quantification (right) of STP measured by 50 stimulations at 10 Hz from STX1AWT, STX1A∆N2-9, STX1A∆N2-19, or STX1A∆N2-28 neurons. The traces show the absolute values, whereas the quantification shows normalized EPSC to EPSC1. (B) Example traces (left) and quantification (right) of the recovery of readily releasable pool (RRP) determined as the fraction of RRP measured at a second pulse of 500 mM sucrose solution after 2 s of initial depletion from STX1AWT, STX1A∆N2-9, STX1A∆N2-19, or STX1A∆N2-28 neurons. (C) Example traces (left) and quantification (right) of the ratio of the charge transfer triggered by 250 mM sucrose over that of 500 mM sucrose as a read-out of fusogenicity of the synaptic vesicles (SVs). (D) Example traces (left) and quantification (right) of Ca2+-sensitivity as measured by the ratio of EPSC amplitudes at [Ca2+]e of 0.5, 1, 2, 4, and 10 mM recorded from STX1AWT, STX1A∆N2-9, or STX1A∆N2-28 neurons. The responses were normalized to the response at [Ca2+]e of 10 mM. (E) Paired-pulse ratio (PPR) of EPSC amplitudes at [Ca2+]e of 0.5, 1, 2, 4, and 10 mM recorded at 40 Hz. (F) Example traces (left) and quantification (right) of STP measured by 50 stimulations at 10 Hz from STX1AWT, STX1ALEOpen, STX1ALEOpen + ∆N2-9, STX1ALEOpen + ∆N2-19, or STX1ALEOpen + ∆N2-28 neurons. The traces show the absolute values, whereas the quantification shows normalized EPSC to EPSC1. (G) Example traces (left) and quantification (right) of the recovery of RRP determined as the fraction of RRP measured at a second pulse of 500 mM sucrose solution after 2 s of initial depletion from STX1AWT, STX1ALEOpen, STX1ALEOpen + ∆N2-9, STX1ALEOpen + ∆N2-19, or STX1ALEOpen + ∆N2-28 neurons. (H) Example traces (left) and quantification (right) of the ratio of the charge transfer triggered by 250 mM sucrose over that of 500 mM sucrose as a read-out of fusogenicity of the SVs. (I) Example traces (left) and quantification (right) of Ca2+-sensitivity recorded from STX1AWT, STX1ALEOpen, STX1ALEOpen + ∆N2-9, or STX1ALEOpen + ∆N2-28 neurons. The responses were normalized to the response at [Ca2+]e of 10 mM. (J) PPR of EPSC amplitudes at [Ca2+]e of 0.5, 1, 2, 4, and 10 mM recorded at 40 Hz from STX1AWT, STX1ALEOpen, or STX1ALEOpen + ∆N2-28 neurons. Data information: the artifacts are blanked in example traces in (A, D, F, I). In (A, D, E, F, I, J), data points represent the mean ± SEM. In (B, C, G, H), data points represent single observations, the bars represent the mean ± SEM. Black and red annotations on the graphs show the significance comparisons to STX1AWT or STX1ALEOpen, respectively. (either nonparametric Kruskal–Wallis followed by Dunn’s post hoc test or one-way ANOVA followed by Holm–Sidak’s post hoc test was applied based on the normality of the data, *p≤0.05, **p≤0.01, ***p≤0.001, ****p≤0.0001). The numerical values are summarized in Figure 6—source data 1.

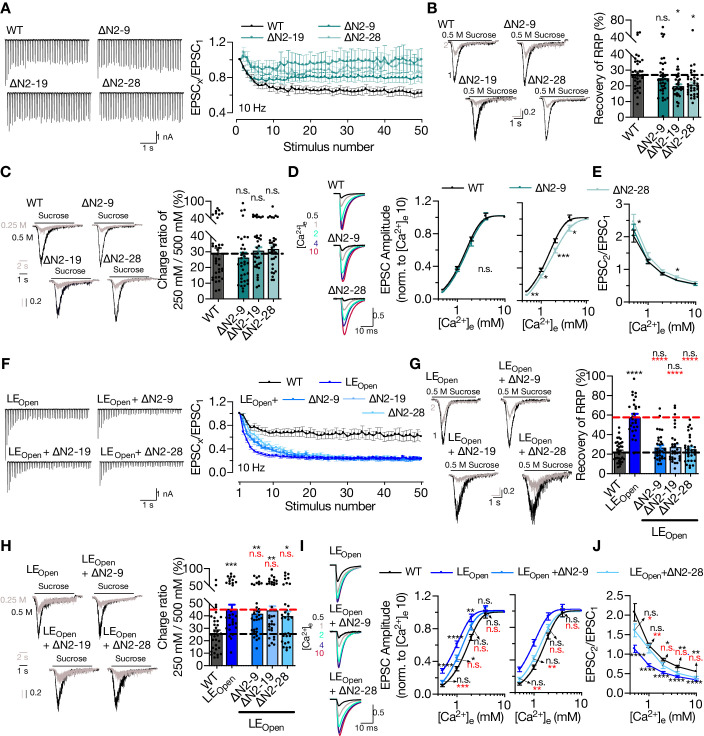
Figure 6—source data 1. Quantification of the STP, recovery of RRP, RRP fraction released by 250 mM sucrose solution application and Ca2+-sensitivity of the vesicles in neurons expressing STX1AWT, STX1AΔΝ- or STX1ALEOpen mutants.

Figure 6.

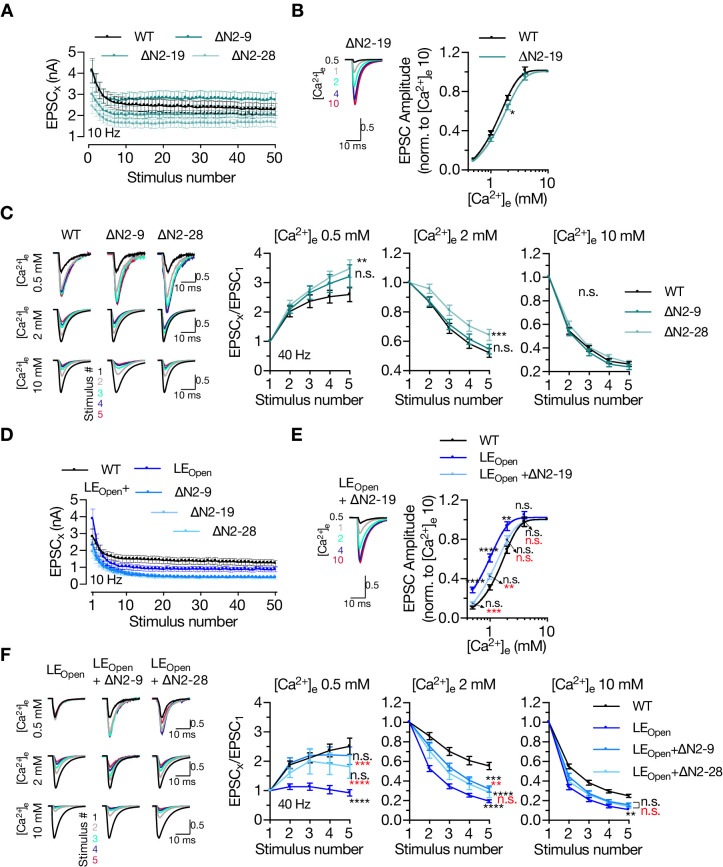
Figure 6—figure supplement 1. Deletion of N-peptide increases the paired-pulse ratio (PPR) both in closed and open conformation of STX1A in low extracellular Ca2+-concentration.

Figure 6—figure supplement 1.

(A) Quantification of absolute values of 50 EPSCs elicited at 10 Hz recorded from neurons expressing either STX1AWT, STX1A∆N2-9, STX1A∆N2-19, or STX1A∆N2-28. (B) Example traces (left) and quantification (right) of Ca2+-sensitivity recorded from neurons expressing STX1A∆N2-19, compared to that of neurons expressing STX1AWT. The responses were normalized to the response at [Ca2+]e of 10 mM. The artifacts are blanked in the example traces. (C) Example traces (left) and quantifications (right) of STP measured at [Ca2+]e of either 0.5 mM, 2 mM, or 10 mM by five stimulations at 40 Hz from neurons expressing either STX1AWT, STX1A∆N2-9, or STX1A∆N2-28. The artifacts are blanked in the example traces. At every [Ca2+]e, the responses were normalized to the EPSC1. (D) Quantification of absolute values of 50 EPSCs elicited at 10 Hz recorded from neurons expressing either STX1AWT, STX1ALEOpen + ∆N2-9, STX1ALEOpen + ∆N2-19, or STX1ALEOpen + ∆N2-28. (E) Example traces (left) and quantification (right) of Ca2+-sensitivity recorded from neurons expressing STX1ALEOpen + ∆N2-19, compared to that of neurons expressing STX1AWT or STX1ALEOpen. The responses were normalized to the response at [Ca2+]e of 10 mM. The artifacts are blanked in the example traces. (F) Example traces (left) and quantifications (right) of STP measured at [Ca2+]e of either 0.5 mM, 2 mM, or 10 mM by five stimulations at 40 Hz from neurons expressing either STX1AWT, STX1ALEOpen + ∆N2-9, or STX1ALEOpen + ∆N2-28. The artifacts are blanked in the example traces. At every [Ca2+]e, the responses were normalized to the EPSC1. Data information: data points in all the graphs represent the mean ± SEM. Black and red annotations (stars and n.s.) on the graphs show the significance comparisons to STX1AWT and STX1ALEOpen rescue, respectively (nonparametric Kruskal–Wallis test followed by Dunn’s post hoc test, *p≤0.05, **p≤0.01, ***p≤0.001, ****p≤0.0001). The numerical values are summarized in Figure 6—figure supplement 1—source data 1.
Figure 6—figure supplement 1—source data 1. Quantification of the absolute values of EPSCs during STP and Ca2+-sensitivity of the vesicles in neurons expressing STX1AWT, STX1AΔΝ- or STX1ALEOpen mutants.
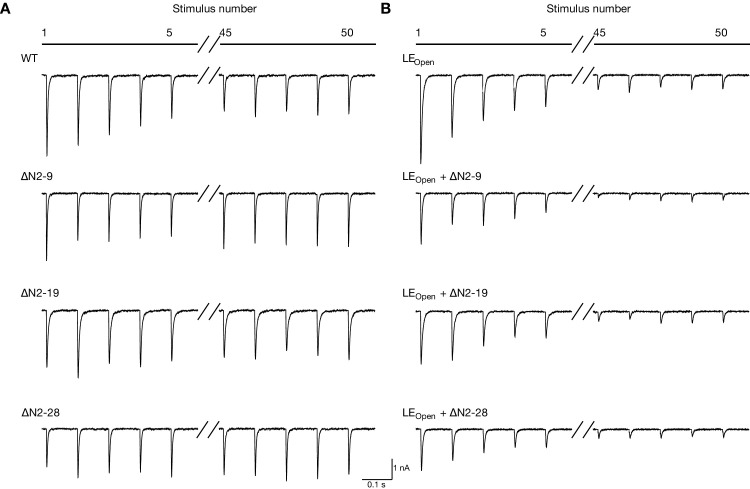
Figure 6—figure supplement 2. Zoomed-in example traces of STP.

Figure 6—figure supplement 2.

(A) Zoomed-in example traces of the first and last five EPSCs recorded by 50 stimulations at 10 Hz from STX1AWT, STX1A∆N2-9, STX1A∆N2-19, or STX1A∆N2-28 neurons. The traces show the absolute values. (B) Zoomed-in example traces of the first and last five EPSCs recorded by 50 stimulations at 10 Hz from STX1ALEOpen, STX1ALEOpen + ∆N2-9, STX1ALEOpen + ∆N2-19, or STX1ALEOpen + ∆N2-28 neurons. The traces show the absolute values.