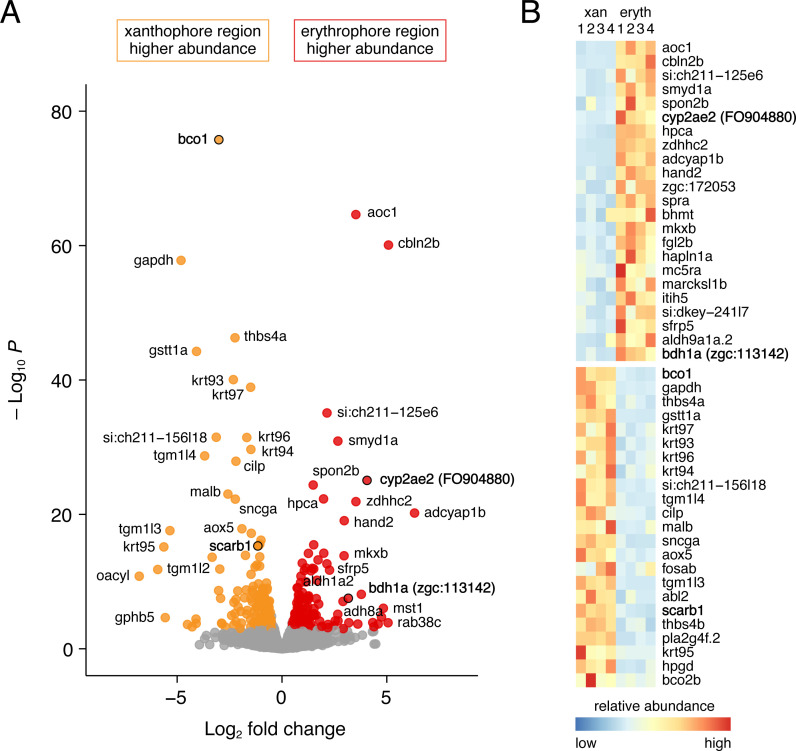
Figure 6. Differential gene expression in fin regions with erythrophores and xanthophores.
(A) Volcano plot of detected transcripts. Yellow–orange and red points indicate transcripts more abundant in xanthophore-containing and erythrophore-containing regions, respectively (q ≤ 0.05). Gray points, transcripts not significantly different in abundance between regions. (B) Heat maps illustrating differential expression of selected loci across fin regions and replicate libraries. Genes with names in bold had phenotypes affecting erythrophore pigmentation.

