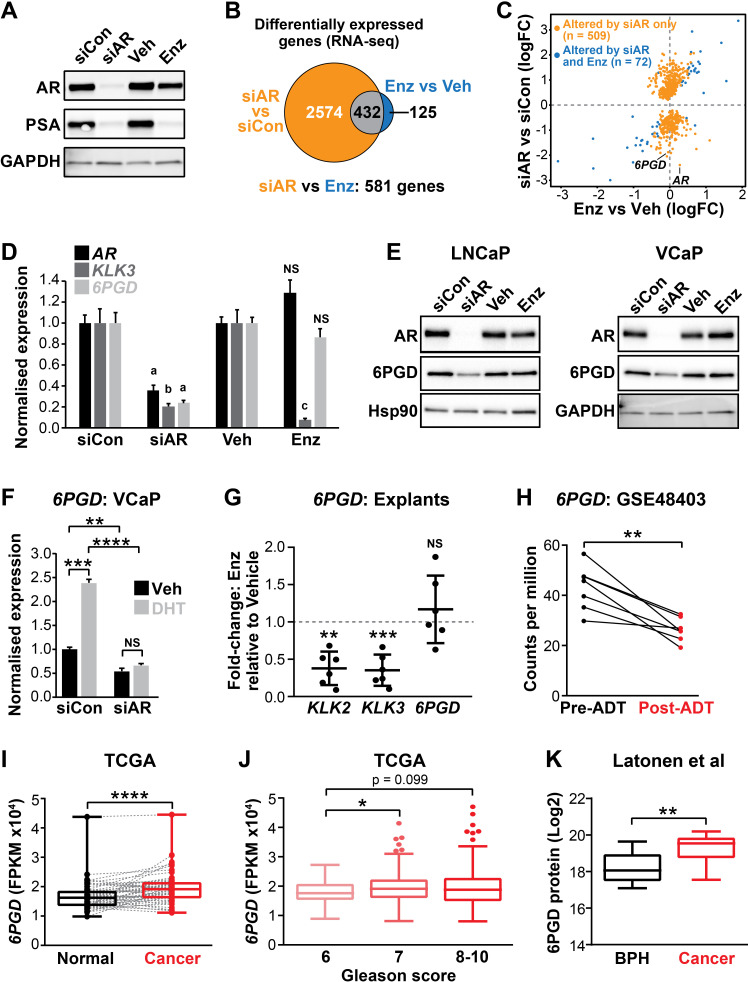
Figure 1. 6PGD is an androgen receptor (AR)-regulated gene and is elevated in prostate cancer.
(A) Effect of siAR and enzalutamide (Enz) on the AR target, PSA. LNCaP cells were transfected with AR (siAR; 12.5 nM) or control (siCon) siRNA for 48 hr or treated with Enz (1 µM) or vehicle (Veh) for 24 hr, after which AR and PSA proteins were evaluated by immunoblotting. GAPDH was used as loading control. (B) Numbers of genes differentially expressed (false discovery rate [FDR] < 0.05) by siAR (versus siCon) or Enz (vs. Veh) are shown in the Venn diagram (at top). Below: an alternative analysis identified 581 genes differentially expressed (FDR < 0.05) by siAR versus Enz. (C) Scatterplot of genes affected by siAR and Enz. The 581 genes differentially expressed by siAR versus Enz are shown in blue (n = 72, genes differentially expressed by siAR versus siCon and Enz versus Veh) and yellow (n = 509), genes differentially expressed by siAR versus siCon but not by Enz versus Veh. (D) Validation of 6PGD expression in response to siAR and Enz by RT-qPCR. Gene expression was normalised to GUSB and L19 and represents the mean ± standard error of the mean (SEM) of three biological replicates; siCon and Veh were set to 1. Differential expression was evaluated using unpaired t tests (a, p<0.01; b, p<0.001; c, p<0.0001; NS, not significant). (E) 6PGD protein levels in response to siAR and Enz treatments were measured by immunoblotting in LNCaP (left) and VCaP (right) cells. HSP90 and GAPDH were used as loading controls. (F) RT-qPCR of 6PGD expression in response to DHT and siAR in VCaP cells. Cells were transfected with siRNAs for 24 hr, and then treated with 1 nM DHT for another 24 hr. Gene expression was normalised and graphed as in (D). Differential expression was evaluated by t tests (**p < 0.01; ***p < 0.001; ****p < 0.0001). (G) RT-qPCR of KLK2, KLK3, and 6PGD expression in response to Enz treatment (1 µM, 72 hr) in patient-derived explants. Gene expression was normalised to GAPDH, PPIA, and TUBA1B and is represented as fold-change relative to vehicle. Differential expression was evaluated by one-sample t tests (**p<0.01; ***p<0.001). (H) 6PGD mRNA expression in prostate tumours pre- and post-androgen deprivation therapy (ADT; GSE48403). A Wilcoxon matched-pairs signed-rank test was used to compare expression in the groups. (I) 6PGD expression is elevated in primary prostate cancer. The TCGA dataset comprises 52 patient-matched normal and cancer samples. Boxes show minimum and maximum (bottom and top lines, respectively) and mean (line within the boxes) values. A paired t test was used to compare expression in normal versus cancer. FPKM: fragments per kilobase of exon per million mapped reads. (J) 6PGD expression by Gleason grade in the TCGA cohort. Boxes show minimum and maximum (bottom and top lines, respectively) and mean (line within the boxes) values. Unpaired t tests were used to compare expression between the groups. (K) 6PGD protein expression in clinical prostate samples (benign prostatic hyperplasia [BPH] and tumours) was measured mass spectrometry. Boxes show minimum and maximum (bottom and top lines, respectively) and mean (line within the boxes) values. An unpaired t test was used to compare expression between the groups.


