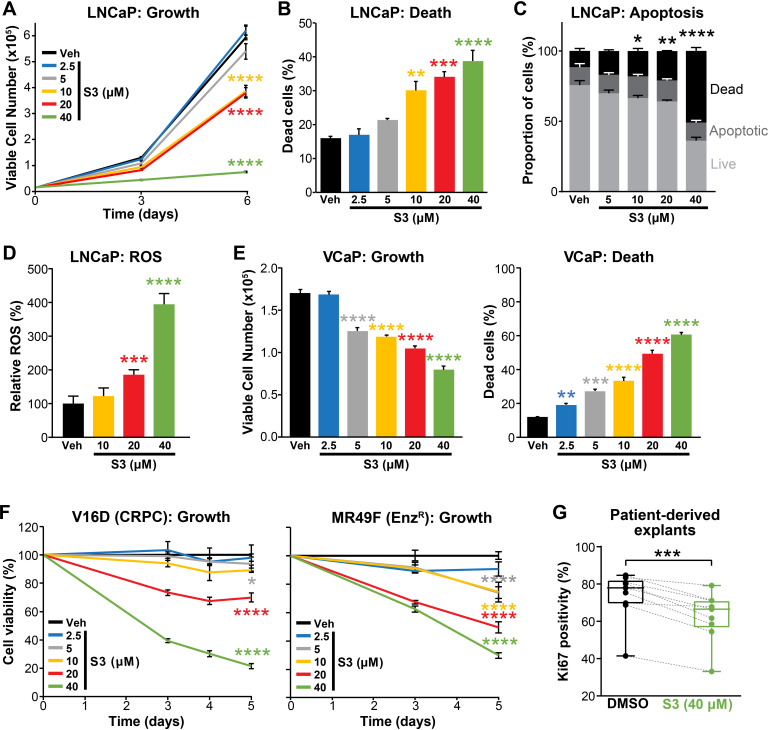
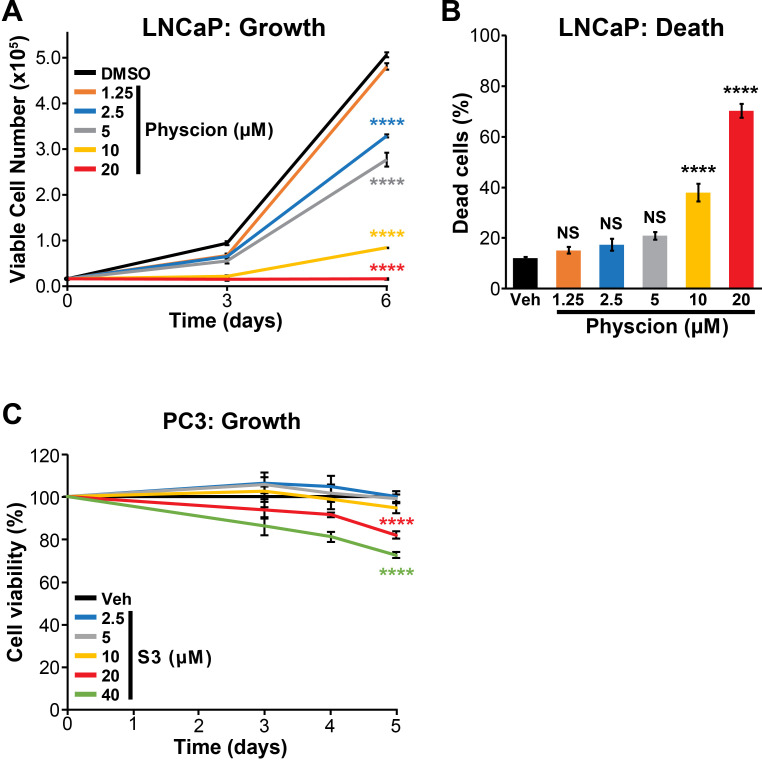
Figure 4. Pharmacological inhibition of 6PGD suppresses prostate cancer growth and increases reactive oxygen species (ROS).
(A, B) The 6PGD inhibitor, S3, dose-dependently decreased viability (A) and increased death (B) of LNCaP cells, as determined by Trypan blue exclusion assays. Dead cells were counted at day 6. Data represent the mean of triplicate samples and are representative of three independent experiments. Error bars are SEM. Growth (day 6) and death for each dose was compared to vehicle using ANOVA and Dunnett’s multiple comparison tests (****p<0.0001). Veh: vehicle. (C) S3 causes apoptosis of LNCaP cells, as determined using flow cytometry-based Annexin V/7-AAD assays. Cells were assessed 72 hr after treatment. Data represent the mean ± SE of triplicate samples and are representative of four independent experiments. Dead cell proportions were compared to vehicle using ANOVA and Dunnett’s multiple comparison tests (*p<0.05; **p<0.01; ****p<0.0001). (D) S3 causes increased levels of ROS in LNCaP cells. Data was normalised to Veh, which was set to 100%. Effects were evaluated using ANOVA and Dunnett’s multiple comparison tests (***p<0.001; ****p<0.0001). (E) S3 dose-dependently decreased viability (left) and increased death (right) of VCaP cells, as determined by Trypan blue exclusion assays. Live and dead cells were counted 4 days after treatment. Data represent the mean ± SE of triplicate samples and are representative of three independent experiments. Effects were evaluated using ANOVA and Dunnett’s multiple comparison tests (**p<0.01; ***p<0.001; ****p<0.0001). (F) S3 suppresses the growth of castration-resistant prostate cancer (CRPC) cells (V16D) and enzalutamide-resistant CRPC cells (MR49F), as determined using CyQuant Direct Cell Proliferation Assay. Fluorescence from day 0 was set to 100%. Data represent the mean ± SEM of triplicate samples and are representative of two independent experiments. Effects (at day 5) were evaluated using ANOVA and Dunnett’s multiple comparison tests (*p<0.05; ****p<0.0001). (G) S3 inhibits the proliferation of prospectively collected human tumours grown as patient-derived explants (PDEs). PDEs (from n = 9 patients) were treated for 72 hr. Ki67 positivity, a marker of proliferation, was determined using immunohistochemistry. Boxes show minimum and maximum (bottom and top lines, respectively) and mean (line within the boxes) values. A paired t test was used to compare Ki67 positivity in treated versus vehicle-treated control samples (***p<0.001).


