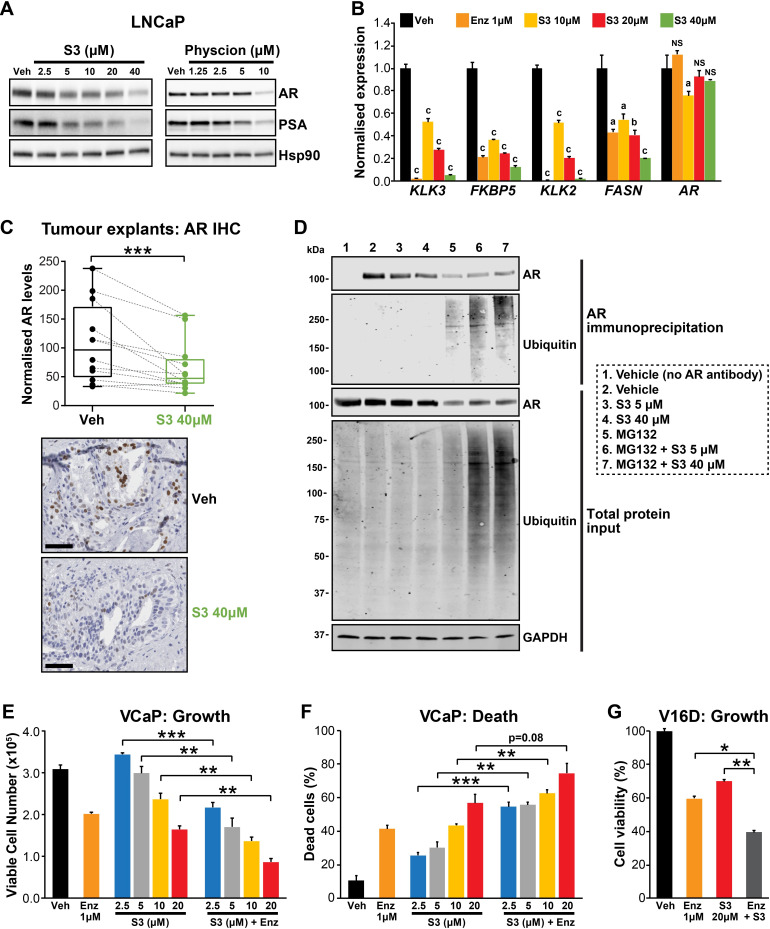
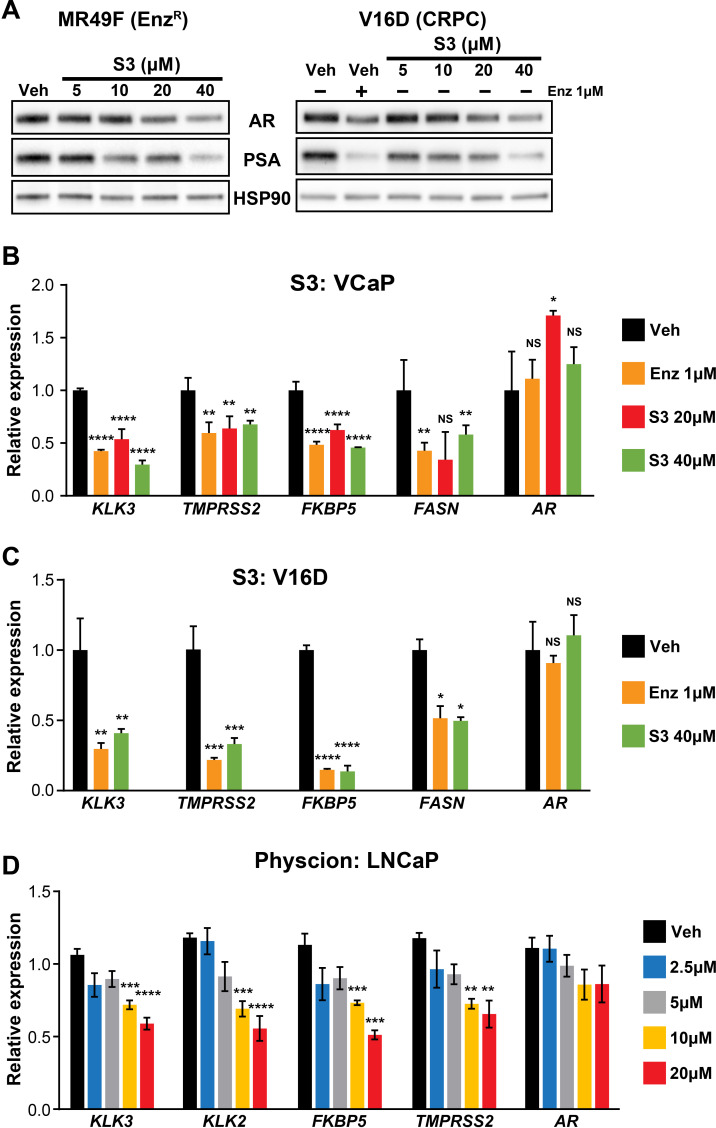
Figure 6. Targeting the androgen receptor (AR)/PGD feedback loop in prostate cancer.
(A) Protein levels of AR and its target PSA in response to S3 (24 hr of treatment) and physcion (48 hr of treatment) in LNCaP cells, as determined by immunoblotting. HSP90 was used as a loading control. (B) AR target gene expression in response to S3 treatment in LNCaP cells, as determined by RT-qPCR. Gene expression was normalised to GUSB and L19 and represents the mean + SEM of three biological replicates; Veh was set to 1. Differential expression was evaluated using ANOVA and Dunnett’s multiple comparison tests (a, p<0.01; b, p<0.001; c, p<0.0001; NS, not significant). (C) S3 reduces AR protein levels in patient-derived explants (PDEs). AR levels in tumours from 14 patients were measured by immunohistochemistry (IHC; left). Boxes show minimum and maximum (bottom and top lines, respectively) and mean (line within the boxes) values. A paired t test was used to compare AR levels in treated versus control samples (***p<0.001). Representative IHC images are shown on the right (scale bars represent 50 µm). (D) S3 enhances AR ubiquitylation. LNCaP cells were treated with indicated concentrations of S3 ±10 µM MG132, or 10 µM MG132 alone, for 24 hr prior to AR immunoprecipitation. Both immunoprecipitates and total protein inputs (1/30 of immunoprecipitates) were subjected to immunoblotting analysis for the indicated proteins. (E, F) Anti-cancer effects of combined Enz and S3 treatment in VCaP cells. Live (E) and dead (F) cells were measured by Trypan blue exclusion assays 4 days after treatment. Data represent the mean + SEM of triplicate samples and are representative of three independent experiments. (G) Anti-cancer effects of combined Enz and S3 treatment in V16D cells. Live cells (F) were measured as in (D) after 3 days of treatment; data are representative of three independent experiments.


