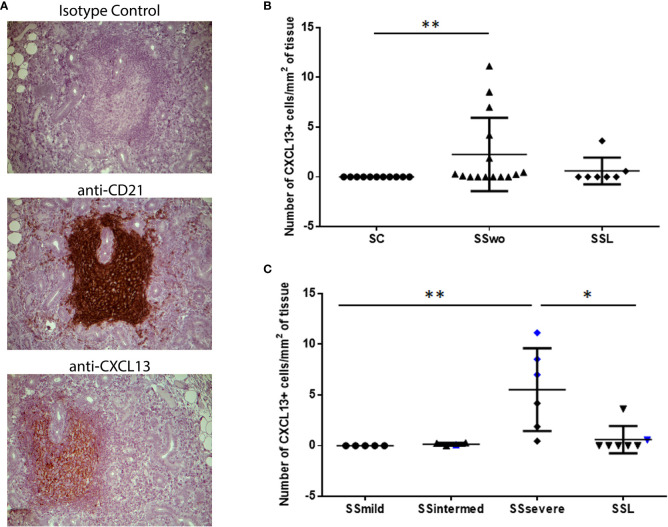
Figure 1.
Levels of CXCL13 expression in the MSG tissues of pSS patients and sicca-complaining controls. (A) CXCL13+-cells are detected in areas of CD21+-FDC networks in the MSG tissues of pSS patients. Representative pictures of immunohistochemical staining with isotype antibody (negative control), anti-CD21 (CD21) and anti-CXCL13 (CXCL13) antibody in MSG sections from a pSS patient with severe infiltrates and germinal center formation are shown. Original magnification: x20. (B) Dot plot displaying the number of CXCL13+-cells per tissue area (mm2) in the MSG tissues of sicca-complaining controls (SC), pSS patients without evidence of NHL (SS) and pSS patients with NHL (SSL). (C) Dot plot displaying the number of CXCL13+-cells per tissue area (mm2) in the MSG tissues of the various subgroups of pSS patients without evidence of NHL, as classified according to lesion severity to those with mild (SSmild), intermediate (SSintermediate) and severe (SSsevere) infiltrates, as well as pSS patients with NHL (SSL). Counts in MSG tissues with ectopic germinal centers (eGCs) are designated by blue color. Comparisons in (B, C) were performed by the non-parametric Kruskal-Wallis test. P-values are designated by asterisks (*p < 0.05, **p < 0.01), whereas horizontal bars represent the mean value of the group. Only statistically significant associations are indicated.

