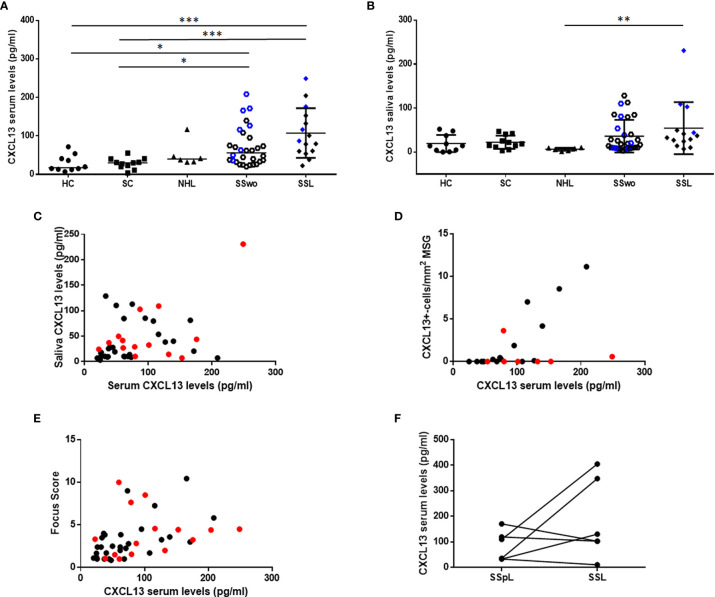
Figure 2.
CXCL13 serum and saliva levels. (A) Dot plot displaying Kruskal-Wallis analysis of CXCL13 serum levels in healthy individuals (HC), sicca-complaining controls (SC), non-SS NHLs (NHL), pSS patients without evidence of NHL (SS) and pSS patients with NHL (SSL). (B) Dot plot representing Kruskal-Wallis analysis of CXCL13 saliva levels in healthy individuals (HC), sicca-complaining controls (SC), non-SS NHLs (NHL), pSS patients without evidence of NHL (SS) and pSS patients with NHL (SSL). P-values are designated by asterisks (*p < 0.05, **p < 0.01, ***p < 0.001), whereas horizontal bars represent the mean value of the group. Only statistically significant associations are indicated. CXCL13 serum and saliva levels from patients with ectopic germinal centers (eGCs) in the MSG infiltrates in panels (A, B) are highlighted by blue color. (C–E) Spearman’s rank correlation analysis of associations between: (C) serum and saliva CXCL13 levels (r=0.368, p=0.014), (D) serum CXCL13 levels and number of CXCL13+-cells per tissue area (mm2) in MSG tissues (r=0.534, p=0.011), (E) serum CXCL13 levels and biopsy focus score (r=0.644, p< 0.0001) in pSS patients. Red color designates samples obtained from pSS patients with NHLs. (F) Wilcoxon’s matched-pair analyses of CXCL13 levels in sequential serum samples from 6 pre-lymphoma pSS patients (SSpL) that transitioned to NHL (SSL) did not reveal any significant changes in CXCL13 expression levels before and on NHL diagnosis.

