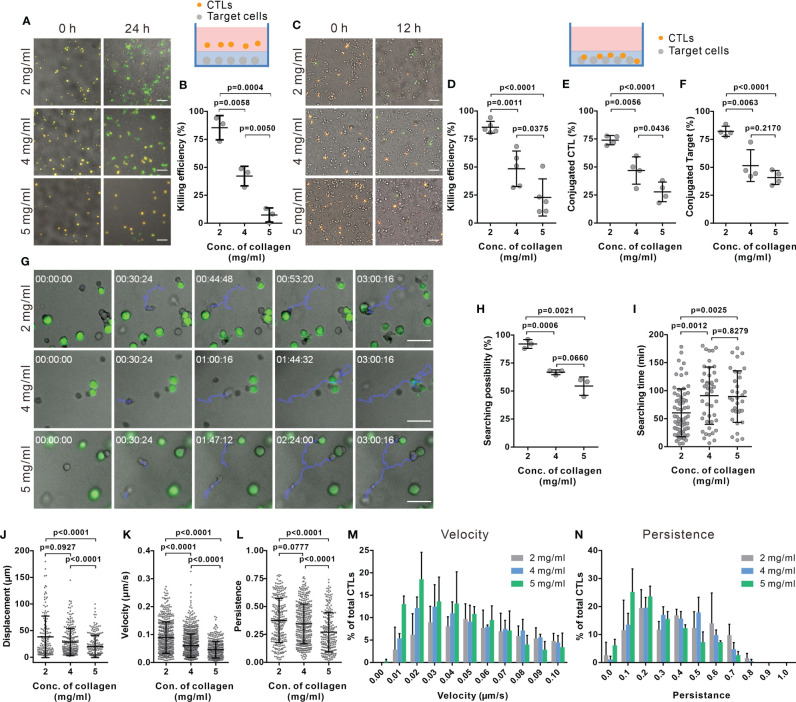
Figure 1.
The killing efficiency of CTLs is substantially decreased in dense collagen matrices. (A, B) CTL killing efficiency is impaired in dense collagen matrices. Target cells (SEA/SEB pulsed NALM-6-pCasper) were embedded in collagen in absence (A, B, 3 donors, E (effector cells): T (Target cells) = 5:1) or presence of CTLs (C, D, 5 donors, E:T=1:1). Images were acquired using ImageXpress with Spectra X LED illumination (Lumencor) for 24 hours (A, B) or 12 hours (C, D). Orange and green color indicates live and apoptotic target cells, respectively. (E, F) Fraction of CTLs in conjugation with target cells (E) or target cells in conjugation with CTLs (F) was analyzed at 1 hour after polymerization (4 donors). (G–I) Searching efficiency of CTLs is reduced in dense collagen. Target cells (SEA/SEB pulsed Raji) were loaded with calcein (green) and embedded in planar collagen with CTLs. Migration was visualized using Cell Observer (20× objective) at 37°C for 3 hours. Representative tracks are shown in (G) (blue lines). The likelihood to find a target within 3 hours is shown in (H) (3 donors). Time required for CTLs to find their first target (if the cell found at least one target cell) is shown in (I). (J–N) Characterization of CTL migration in collagen matrices. CTLs were transfected with histone 2B-GFP and LifeAct-mRuby, and then embedded in 3D collagen. Migration was visualized using light-sheet microscopy (20× objective) every 30 sec for 30 min. The nuclei positions were identified with Imaris to analyze displacement (J), velocity (K), and persistence of CTLs (L) (3 donors). The distribution of CTL velocity and persistence is shown in (M, N), respectively. One dot represents either one donor (in B, D–F, H) or one cell (in I–L). Results are presented as Mean ± SD. The unpaired Student’s t-test was used for statistical significance, except (I–L) (the Mann-Whitney test was used). Scale bars are 50 μm.

