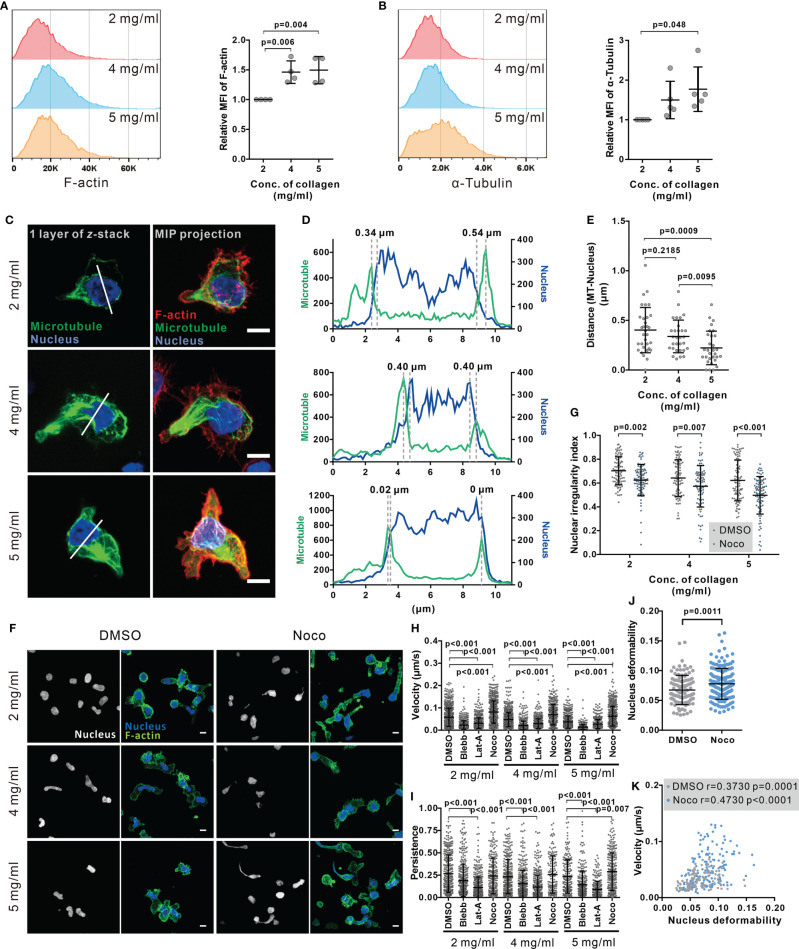
Figure 4.
Disruption of microtubule network enhances CTL nuclear deformation and migration in dense collagen matrices. (A, B) Dense matrices slightly up-regulates expression of F-actin and α-tubulin. CTLs were embedded in the collagen matrix for 5 hours after polymerization and then recovered from collagen. The F-actin and α-tubulin were stained with Alexa 488-Phalloidin and anti α-Tubulin mAb antibody. The samples were analyzed with flow cytometry. Presentative donors are shown in the left panels and the quantifications are shown in the right panels. One dot represents one donor. (C–E) The microtubule network is located at the nucleus-surrounding region. CTLs were transfected with EMTP-3×GFP (green). 24 hours post-transfection CTLs were fixed and stained with Hoechst 33342 (blue), and Alexa 568-phalloidin (F-actin, red). Images were acquired with confocal microscopy (63× objective). MIP: maximum intensity projection. Scale bars are 5 µm. The fluorescence intensity along the random line cross nucleus depicted in (C) is shown in (D). Distance between microtubules and nucleus is defined as the distance between two maxima as indicated in (D) and quantified in (E). (F, G) Disruption of the microtubule network increases the level of nuclear deformation in CTLs. Collagen-embedded CTLs were treated with nocodazole (Noco, 10 µM) or DMSO for 5 hours prior to fixation. Then CTLs were stained with Hoechst 33342 (blue) and Alexa 488-phalloidin (F-actin, green). Images were acquired with confocal microscopy (63× objective). Exemplary images are shown in (F). Quantification of the nuclear irregularity index in maximum intensity projection is shown in (G). (H, I) Impact of cytoskeletal components on CTL migration in 3D. Hoechst 33342-stained CTLs were embedded in planar collagen and treated with DMSO, blebbstatin (Blebb, 50 µM), latrunculin-A (Lat-A, 50 nM), or nocodazole (Noco, 10 µM). Migration was visualized with cell observer (20× objective) at 37°C for 30 min. Migration velocity and persistence are shown in (H, I), respectively. (J, K) Disruption of the microtubule network enhances nuclear deformability. CTLs were embedded in collagen (5 mg/ml) and then treated as in (H, I). Average deformability of CTLs is shown in (J). Correlation between migration velocity and nuclear deformability is shown in (K). The correlation coefficient r is analyzed with Spearman’s correlation. One dot represents one cell. Scale bars are 5 µm. Results are presented as Mean ± SD from 3 donors. For statistical significance, the unpaired Student’s t-test (in A, B, E) or the Mann-Whitney test (G–J) was used.

