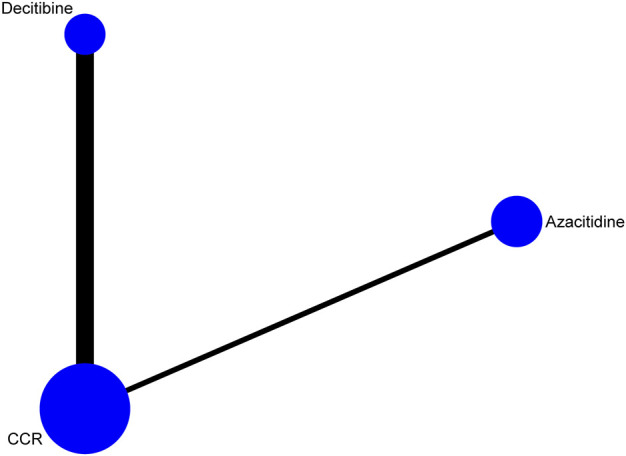
FIGURE 2.

Network of interventional treatments comparing types of acute myeloid leukemia and higher-risk myelodysplastic syndrome (CR). The sizes of the nodes represent the total sample size for each treatment. Line thickness and the numbers beside the lines correspond to the number of trials. CCR, conventional care regimens.
