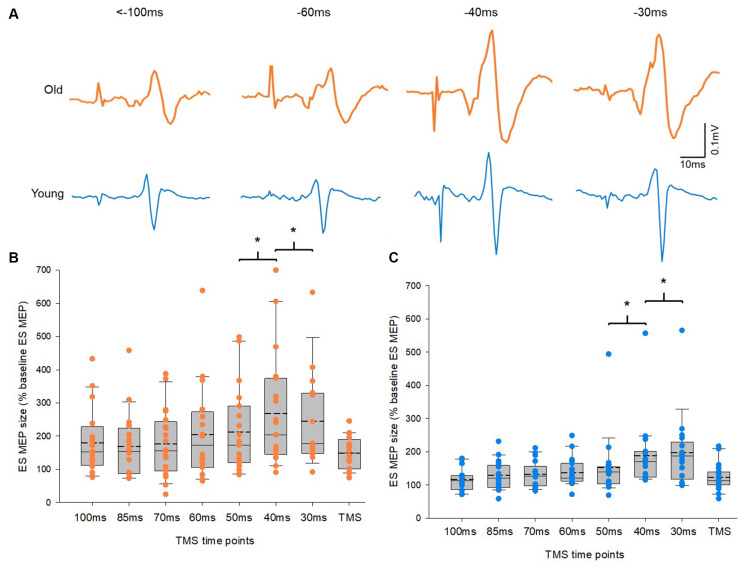
Figure 3.
Motor evoked potentials (MEPs) in the erector spinae (ES) muscle. (A) MEP traces recorded from the ES muscle of representative old and young participants. Traces show the average of 10 MEPs in the ES muscle at various time points prior to the RRT and within the window of anticipatory postural adjustments (APAs). Group data (B) from older participants (n = 20) and (C) from young participants (n = 20) showing changes in MEPs in the ES muscle along the course of time in the APA window. The abscissa shows the time points where transcranial magnetic stimulation (TMS) was given with respect to the actual recognition reaction time (RRT). TMS means trials with no visual cue but pulses of TMS. The ordinate shows the size of ES MEP (as a % of the ES MEP obtained at baseline when participants were not expecting to react to a visual cue). Note that the size of ES MEPs increases significantly at 40 ms and 30 ms prior to the RRT in both old and young participants. The box is interquartile range; error bars denote maximum and minimum values. *p < 0.05, comparisons between time points.

