Figure 1.
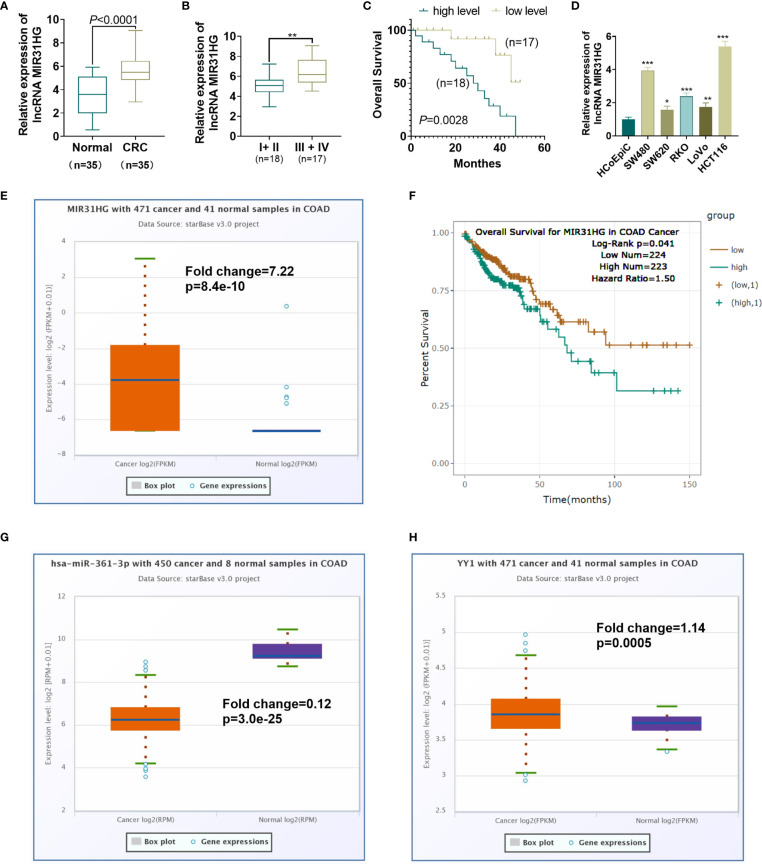
Expression characteristics of MIR31HG in CRC. (A) qRT-PCR was conducted to test the MIR31HG expression in 35 CRC tissues and 20 normal tissues. ***P < 0.001(vs. normal group). (B) The level of MIR31HG in two groups of CRC tissues (stage I-II vs.stage III-IV) was analyzed. (C) K-M plotter was used for analyzing the association between MIR31HG level with the overall survival of CRC patients. The survival curve of the 35 CRC patients was shown. P=0.0448 (vs. low MIR31HG level group). (D) The MIR31HG profile in CRC cells (Caco-2, RKO, SW480, SW620, LoVo and HCT116) and Human colonic epithelial cells (HCoEpiC). *P < 0.05, **P < 0.01, ***P < 0 .001 (vs. HCoEpiC group). (n=3). (E) MIR31HG level in CRC tissues (data of cancers were downloaded from TCGA project via Genomic Data Commons) was analyzed via ENCORI (The Encyclopedia of RNA Interactomes, http://starbase.sysu.edu.cn/index.php). (F) That the higher level of MIR31HG was associated with poorer survival of CRC patients analyzed by ENCORI database. G-H. miR-361-3p (G) and YY1 (H) levels in CRC tissues were analyzed through ENCORI (The Encyclopedia of RNA Interactomes, http://starbase.sysu.edu.cn/index.php).

