Figure 7.
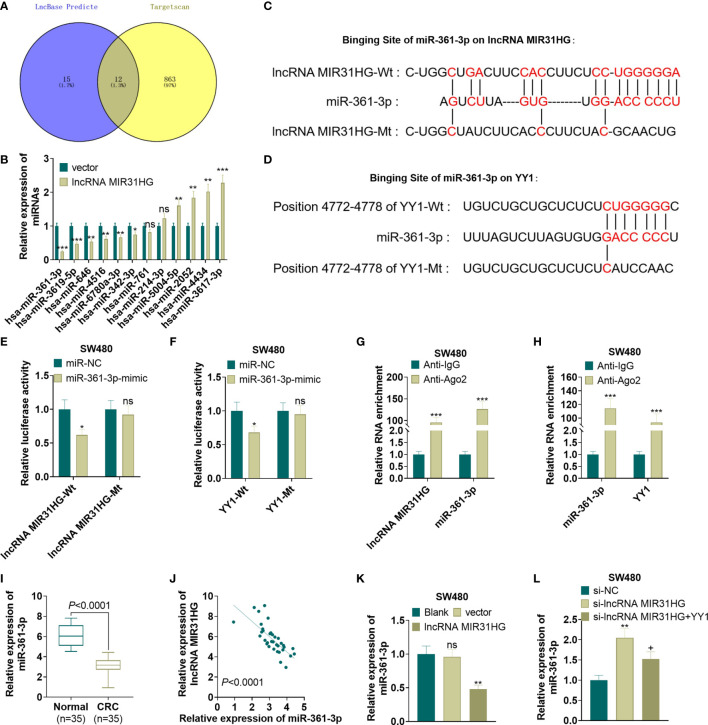
MiR-361-3p targeted MIR31HG and YY1. (A) The miRNA targets of MIR31HG and YY1 were predicted via lncBase v.2 (http://carolina.imis.athena-innovation.gr/diana_tools/web/index.php?r=lncbasev2%2Findex) and Targetscan (http://www.targetscan.org/vert_72/), respectively. 12 miRNAs were potential targets of MIR31HG and YY1 via Venn’s diagram analysis. (B) qRT-PCR was used to detect miR-361-3p in SW480 cells transfected with MIR31HG overexpression plasmids. (C, D). The base binding sequences of miR-361-3p, MIR31HG and YY1 were shown. (E-H). The binding relationship between miR-361-3p, MIR31HG and YY1 was examined by the dual-luciferase reporter assay and RIP assay. nsP > 0.05, *P < 0.05, ***P < 0.001 (vs. the miR-NC/Anti-IgG group). (I) Expression of miR-361-3p in CRC tissues and normal tissues was measured by qRT-PCR. ***P < 0.001(vs. normal group). (J) Correlation analysis of miR-361-3p and MIR31HG in CRC tissues. (K) The miR-361-3p expression in SW480 cells after overexpressing MIR31HG was examined by qRT-PCR. ns P > 0.05 (vs.Blank group). **P < 0.01 (vs. the vector group). (L). qRT-PCR detected the miR-361-3p profile after knockdown of MIR31HG and overexpression of YY1. **P < 0.01 (vs. Si-NC group). +P < 0.05(vs. Si- MIR31HG group). (n=3).

