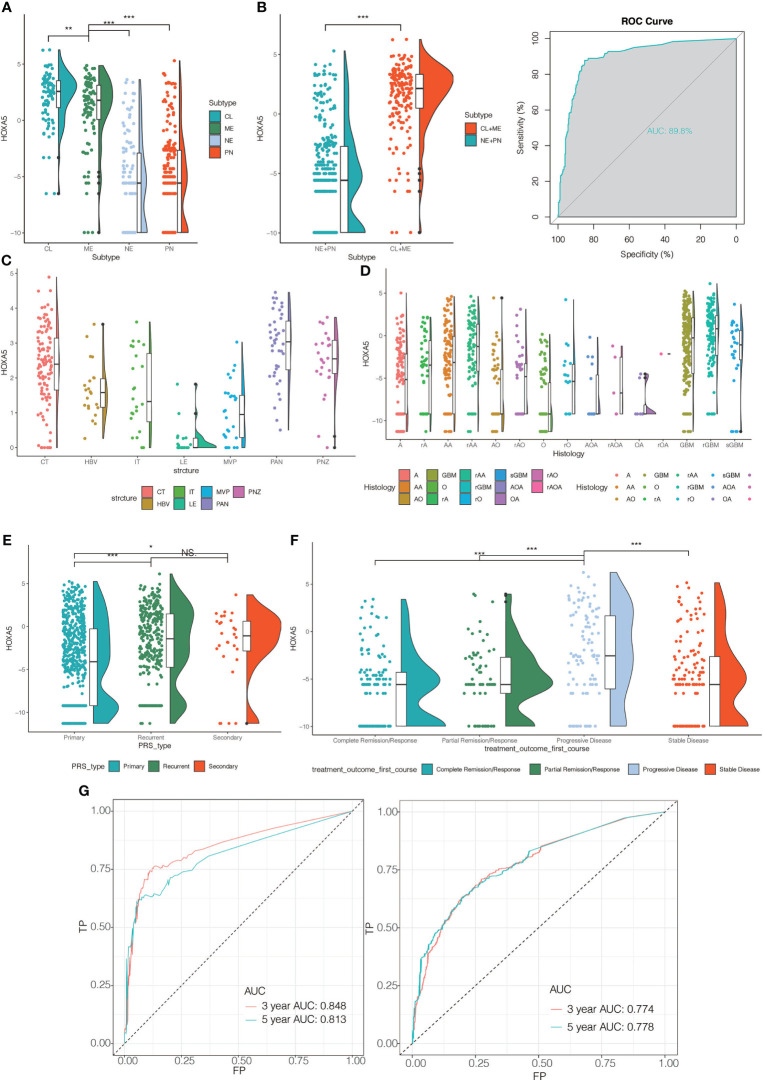
Figure 2.
(A) The HOXA5 expression pattern in the TCGA molecular subtype in pan-glioma analysis. (B) HOXA5 was upregulated in CL and ME subtypes by comparing to NE and PN subtypes in pan-glioma analysis in TCGA data set. Receiver operating characteristic (ROC) curve to assess sensitivity and specificity of HOXA5 expression as a diagnostic biomarker for the ME and CL molecular subtypes in gliomas. (C) Intra-tumor analysis of HOXA5 expression using IVY GBM RNA-seq data. Anatomic structures analyzed are the following: LE (leading edge), IT (infiltrating tumor), CT (cellular tumor), PAN (pseudopalisading cells around necrosis), PNZ (perinecrotic zone), MVP (microvascular proliferation), and HBV (hyperplastic blood vessels). (D) The expression levels of HOXA5 based on the histopathologic classification. (E) The expression level of HOXA5 in primary, recurrent, secondary glioma types. (F) The expression level of HOXA5 in different first-course treatment outcomes. (G) ROC curve indicating sensitivity and specificity of HOXA5 expression as a diagnostic biomarker for 3- and 5-year survivals in pan-glioma analysis in TCGA and CGGA data sets. A, low-grade astrocytoma; AA, anaplastic astrocytoma; AO, anaplastic oligodendroglioma; GBM, glioblastoma; O, oligodendroglioma; rA, recurrent low-grade astrocytoma; rAA, recurrent anaplastic astrocytoma; rGBM, recurrent glioblastoma; rO, recurrent oligodendroglioma; sGBM, secondary glioblastoma; AOA, anaplastic oligoastrocytoma; OA, oligoastrocytoma. NS, Not Statistically Significant; *P < 0.05; **P < 0.01; ***P < 0.001.

