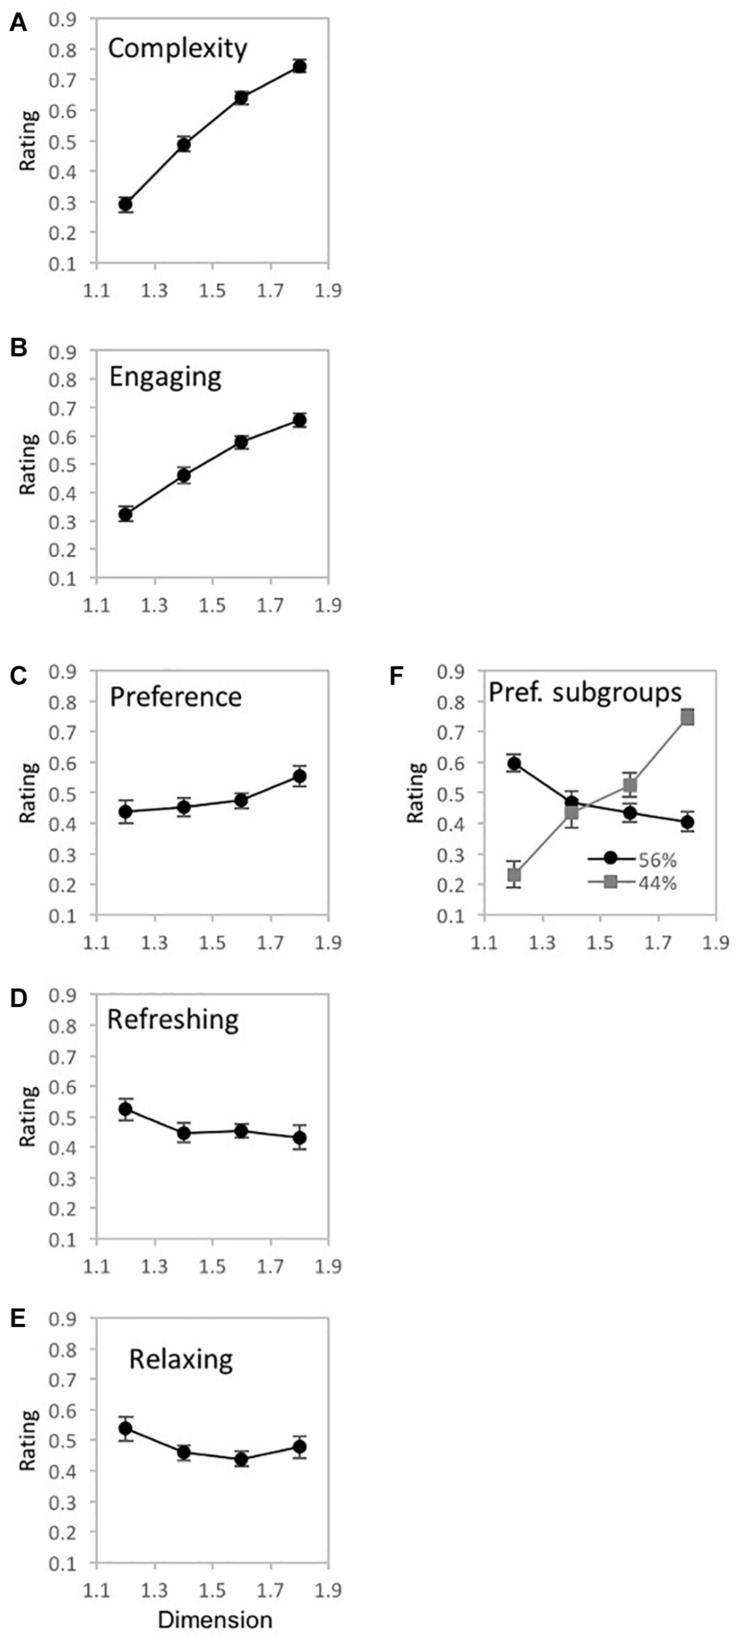
FIGURE 11.
Experiment 2 results for ‘tree-seed’ fractal patterns for 5 different judgment conditions (how complex, engaging, preferred, refreshing, and relaxing). (A–E) shows plots of mean ratings as a function of fractal dimension (D) for the different judgment conditions (error bars represent standard error). (F) shows a plot of the mean ratings as a function of fractal dimension (D) for each subpopulation identified with cluster analysis (error bars represent standard error).

