
Fig. 1.
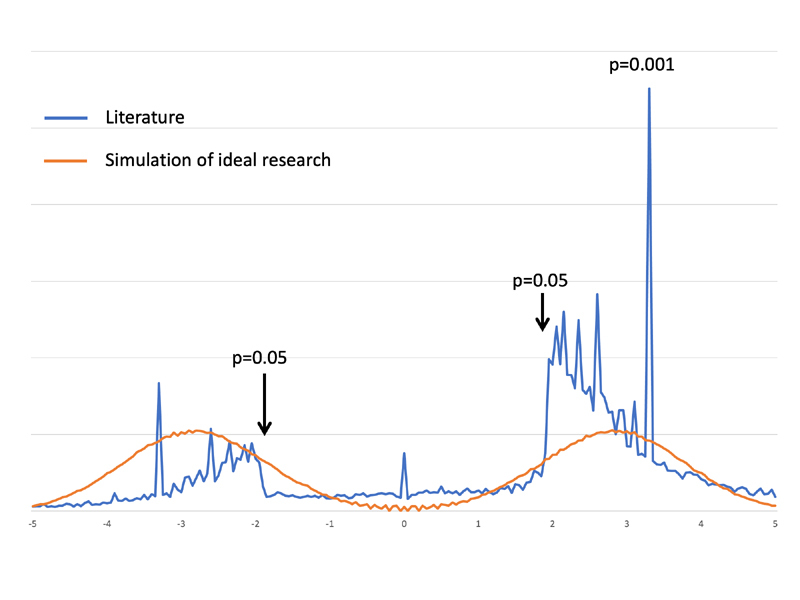
Publication bias in the observational research literature. Based on extracting the statistical significance of 29,982 observational research results from the literature [ 4 ], we plotted (blue line) the relative number of results (y-axis) with a given two-tailed z-score (x-axis) for each study, with a negative z-score indicating that the outcome occurred less often in the primary intervention. The p-values for several z-scores are marked. Note the sharp drop in results for z-scores corresponding to p-values over 0.05. Part of the explanation for few non-significant studies may be that researchers are good at guessing which hypotheses will come out significant. We therefore also plotted (red line) the z-score distribution that one would get if only true hypotheses were studied. Even perfect knowledge cannot duplicate the sharp drop at p=0.05. Publication bias is the only reasonable explanation.