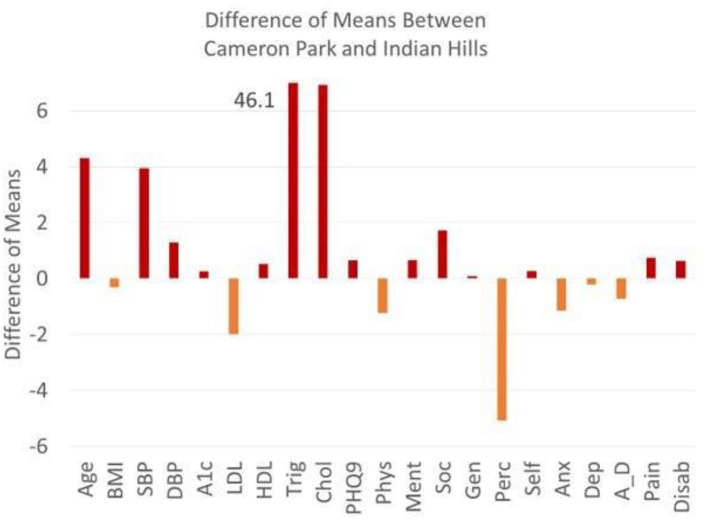
Figure 1.
Differences between means between cameron park and Indian hills. The plot of the difference of means as calculated by hoteling T2 is the squared difference of mean vectors scaled against the co-variance matrix for age (yrs), BMI, SBP (systolic blood pressure), DBP diastolic blood pressure), A1c (HbA1C), LDL, HDL, Trig (Triglycerides), Chol (Cholesterol), PHQ9, physical health, mental health, social health, general health, perceived health, self-esteem, anxiety, depression, anxiety-depression, pain, disability. Above zero reflects a higher Cameron Park (red) and below zero reflects a higher Indian Hills Value (orange). Triglyceride means do not fit on the graph and are defined by the means across Colonia.

