FIGURE 2.
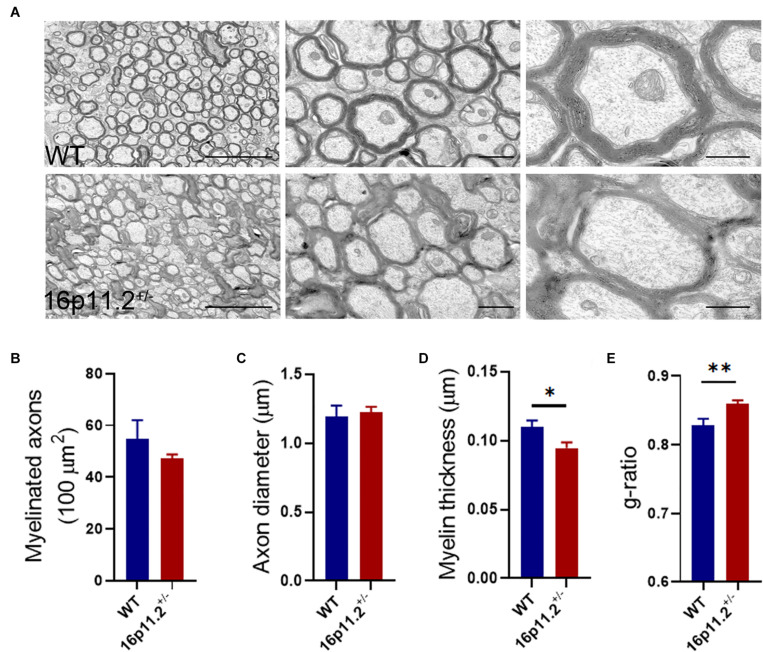
Decreased myelin thickness in 16p11.2± striatum. (A) Representative TEM images of myelinated axons in the striatum of P60 16p11.2± mice (lower panels) and WT controls (upper panels). Scale bars, 5 μm (left), 1 μm (middle) and 0.5 μm (right). (B–E) Comparison of myelinated axon number (B), axon diameter (C), myelin thickness (D), and myelin g-ratio (E) in the striatum of 16p11.2± mice versus WT controls (3 mice per group). All myelinated axons were counted (B) but only clearly-defined myelinated axons were measured [(C–E), WT: n = 267, 16p11.2±: n = 131] in 15 microscope fields (5 field per mouse) under study for each group. Data were analyzed by unpaired t tests (mean ± SEM, *p < 0.05, **p < 0.01).

