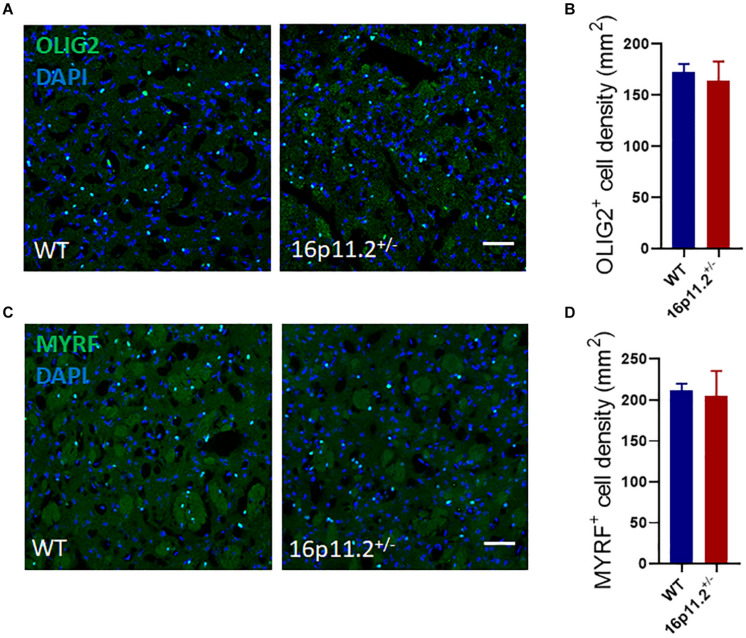
FIGURE 3.
Oligodendrocyte lineage cell numbers are unchanged in 16p11.2± striatum. (A,C) Representative images of OLIG2+ [green, (A)] oligodendrocyte lineage cells and MYRF+ [green, (C)] differentiated/mature oligodendrocytes in striatum sections of P60 16p11.2± mice and WT controls. Nuclei were counterstained with DAPI (blue). (B,D) Comparison of OLIG2+(B) and MYRF+ (D) cell numbers in the striatum of 16p11.2± mice versus WT controls, showing no significant differences (data from 4 mice per group, mean ± SEM, unpaired t test). Scale bar = 50 μm.

