FIGURE 6.
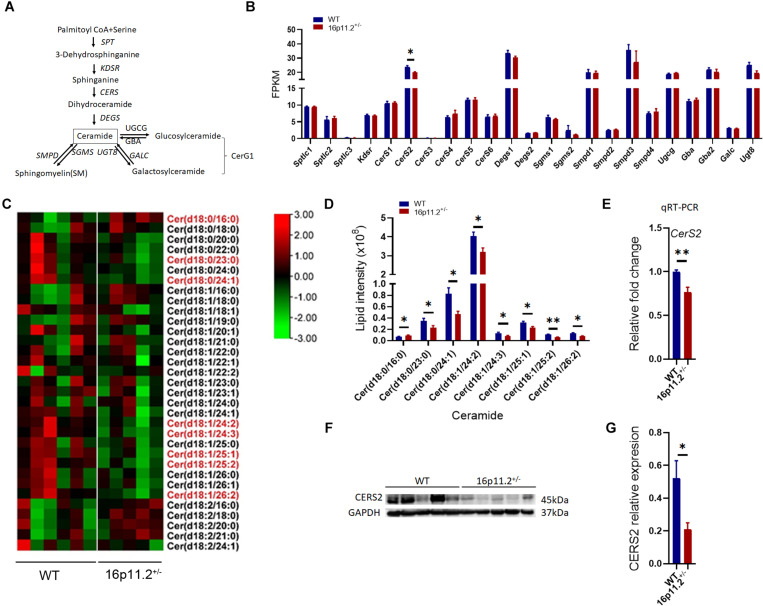
Decreased Cer species and CerS2 expression in 16p11.2± striatum. (A) Diagram of ceramide metabolism. (B) Expression levels of genes involved in ceramide synthesis revealed by RNAseq analysis using RNA isolated from striatum tissues of P60 16p11.2± mice (n = 4) and WT controls (n = 4). Only CerS2 expression was significantly reduced in 16p11.2± striatum. (C) Heatmaps of Cer species identified by lipidomics analysis in the striatum of P60 16p11.2± mice (n = 5) and WT controls (n = 6). The Cer species displaying a significant change in level in 16p11.2±striatum are written in red. (D) Chart of comparing the “red” Cer species, indicating their decreased levels in the striatum of 16p11.2± mice in relation to WT controls. (E) Reduced CerS2 expression (relative to Gapdh) in 16p11.2± striatum as assessed by qRT-PCR (n = 4 mice). (F,G) Reduced CERS2 expression in 16p11.2± striatum revealed by Western blotting (n = 5 mice). CERS2 expression was examined by Western blotting (F) and normalized against GAPDH for quantitative comparison. (G) Data were analyzed with unpaired t tests (mean ± SEM, *p < 0.05, **p < 0.01). FPKM, Fragments per kilobase of transcript per million mapped reads.

